April 27, 2020 / Nirav Shah
ABSTRACT : AWS Cloudwatch has a cloudwatch agent service that can be used to view custom instance metrics like disk-space utilization, etc. and can be used to set alarms and notifications for the same to stay informed on the resources your instance is using.
For starters lets see what metrics we get when cloudwatch agent is not installed and for this we will use the de-facto guinea pig instance family-type “t2.micro”, in the cheapest AWS region “North Virginia”, while using our Go-To O.S which is “ubuntu 18.04 LTS”.
We will keep all the Instance Launch-settings to default and we are not going to enable “Enable Cloudwatch detailed monitoring” as that is not in the scope of this blog, just in-case that’s a confusion; “Cloudwatch Detailed Monitoring” is a slightly different topic in the sense that it provides you metrics at as low as “per minute” whereas we are setting up Cloudwatch to view custom metrics which detailed monitoring does not enable by default and would need the same procedure of setup even if it is enabled in the first place.
This whole setup should not incur you any extra charges to the best of our knowledge as cloudwatch offers services (at a limit) free for lifetime, you can check by going to this page; and searching for cloudwatch in the search bar and you should be able to see the condition under which it is free for lifetime.
Anyways, going forward towards the setup, once we have launched our guinea-pig in north virginia with the OS that is the saviour of all Server Admins (geeky giggles…); we first of all check what all metrics we can get in the cloudwatch dashboard without installing cloudwatch agent.
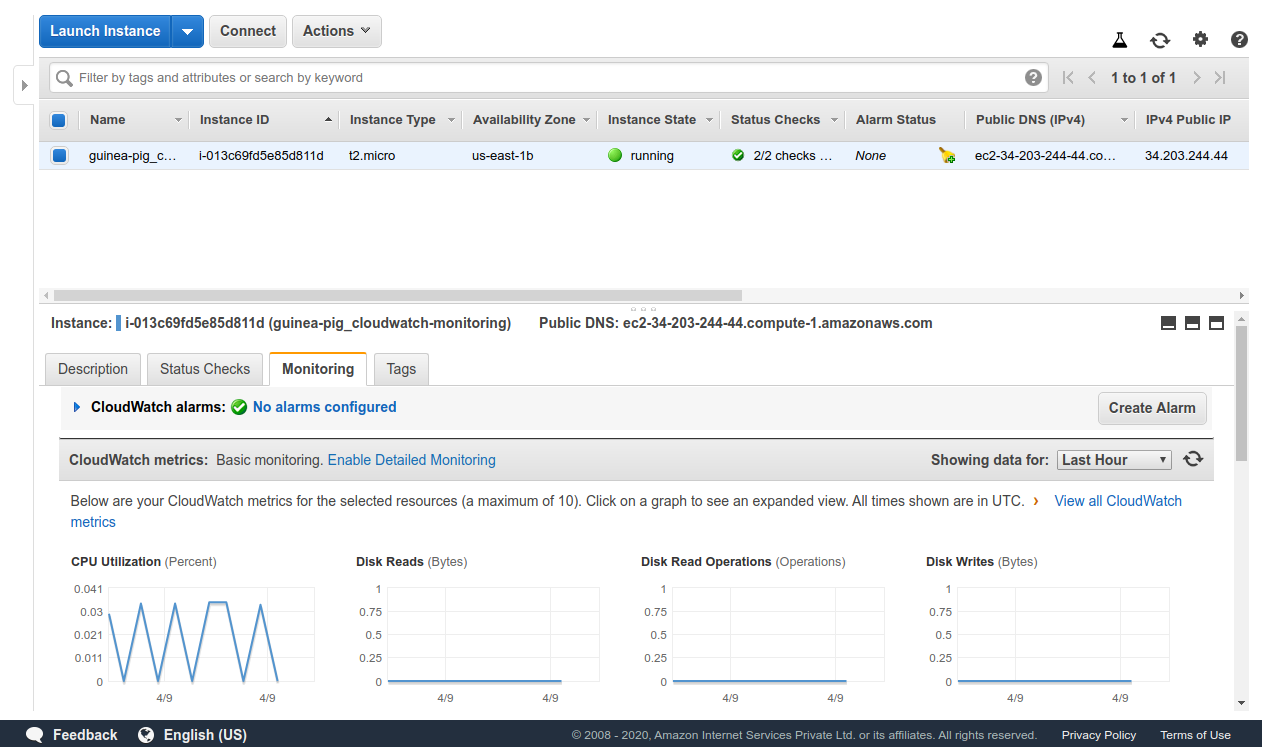
As we can see in the above screenshot when we click on monitoring, we are now able to see the various default metrics that we can view and can set alarms for. Now let’s go to the cloudwatch service dashboard for the N.Virginia region.
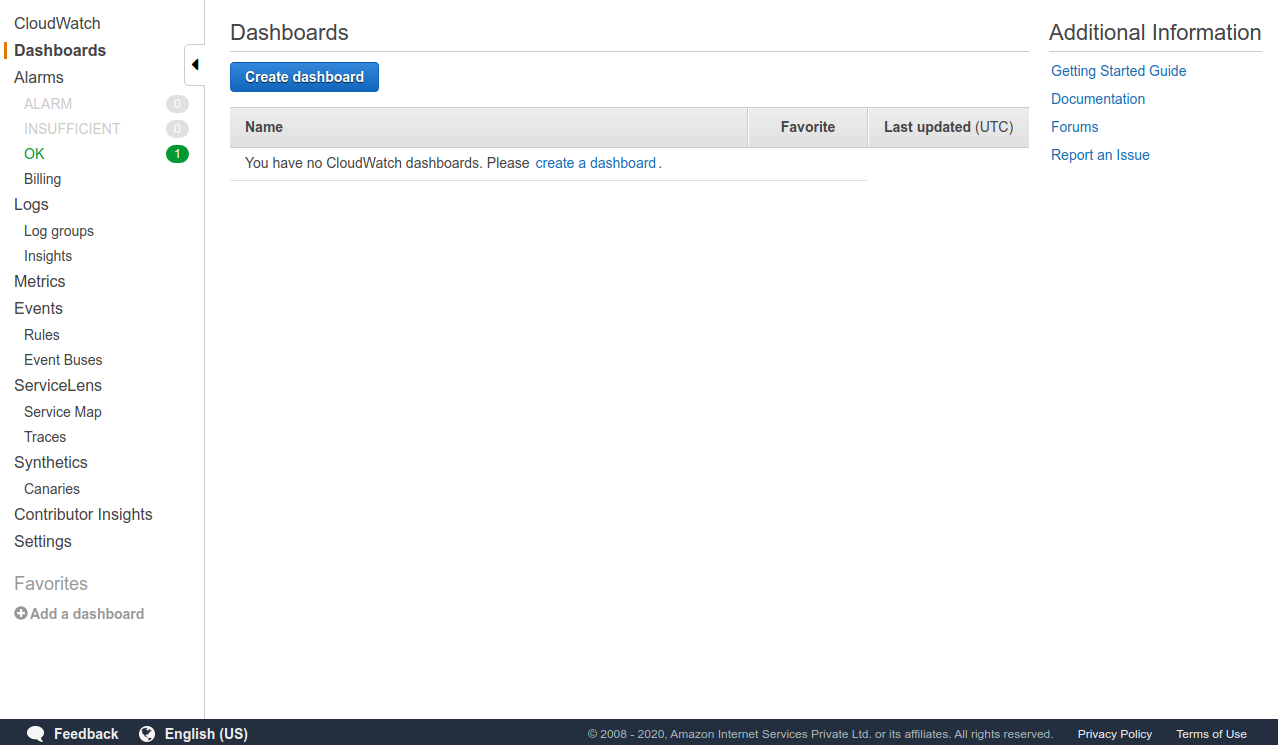
As seen in the above screenshot there is no dashboard configured for now so we’ll go forward and create one.
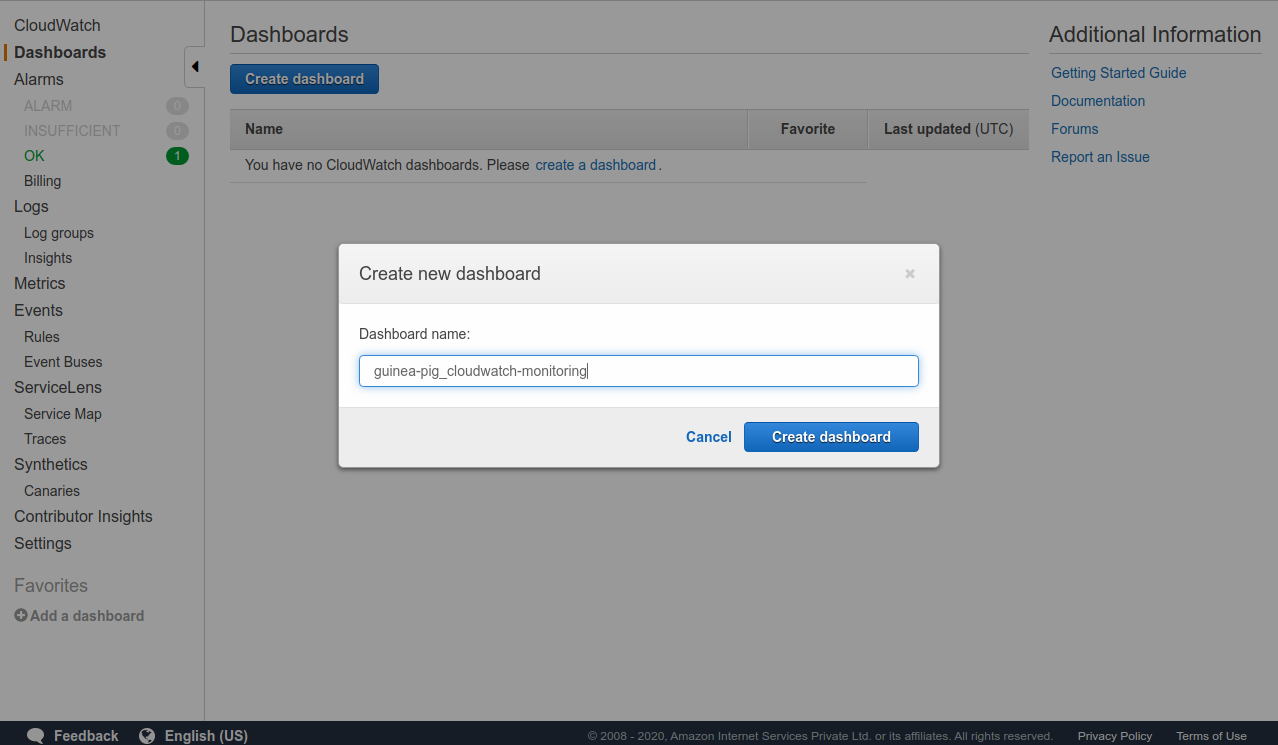
As seen in the above screenshot we have now created a dashboard and as soon as we create one we are greeted with the following popup.
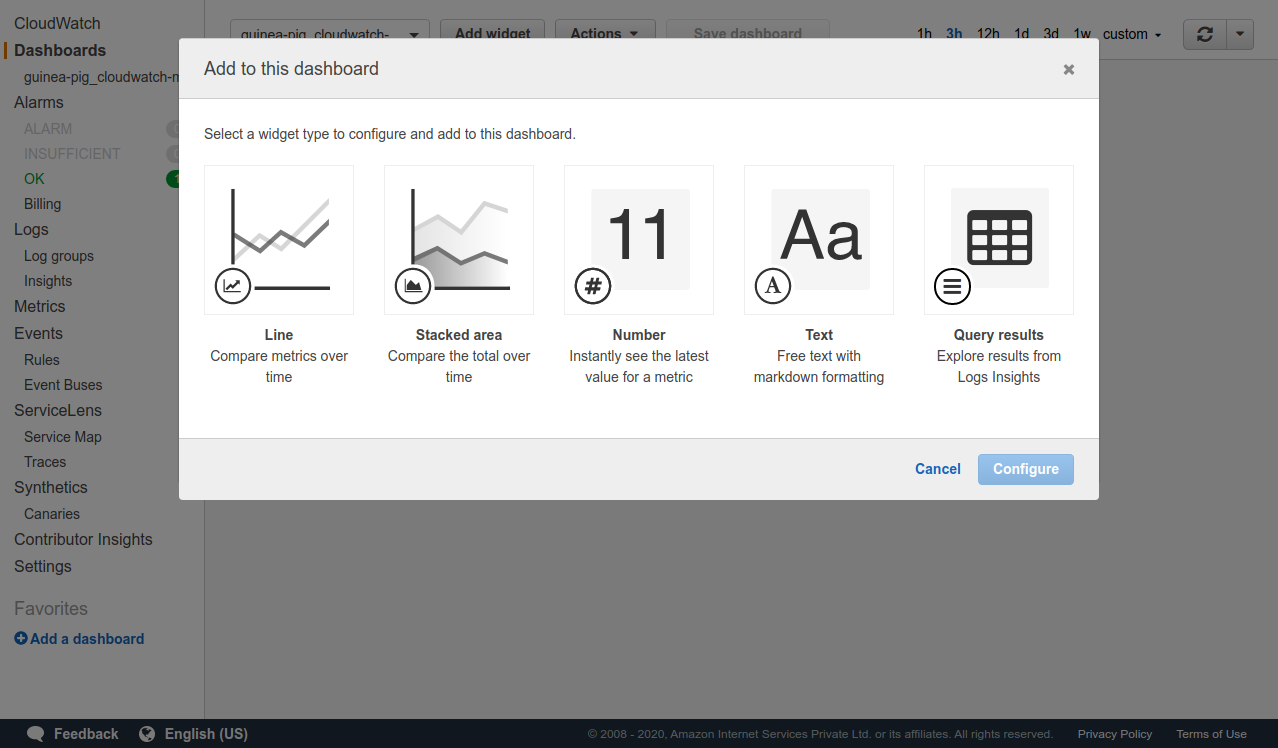
Which, basically, is prompting us to choose any of the provided widget types to add to the dashboard so we will choose the “Number” one and click on Configure.
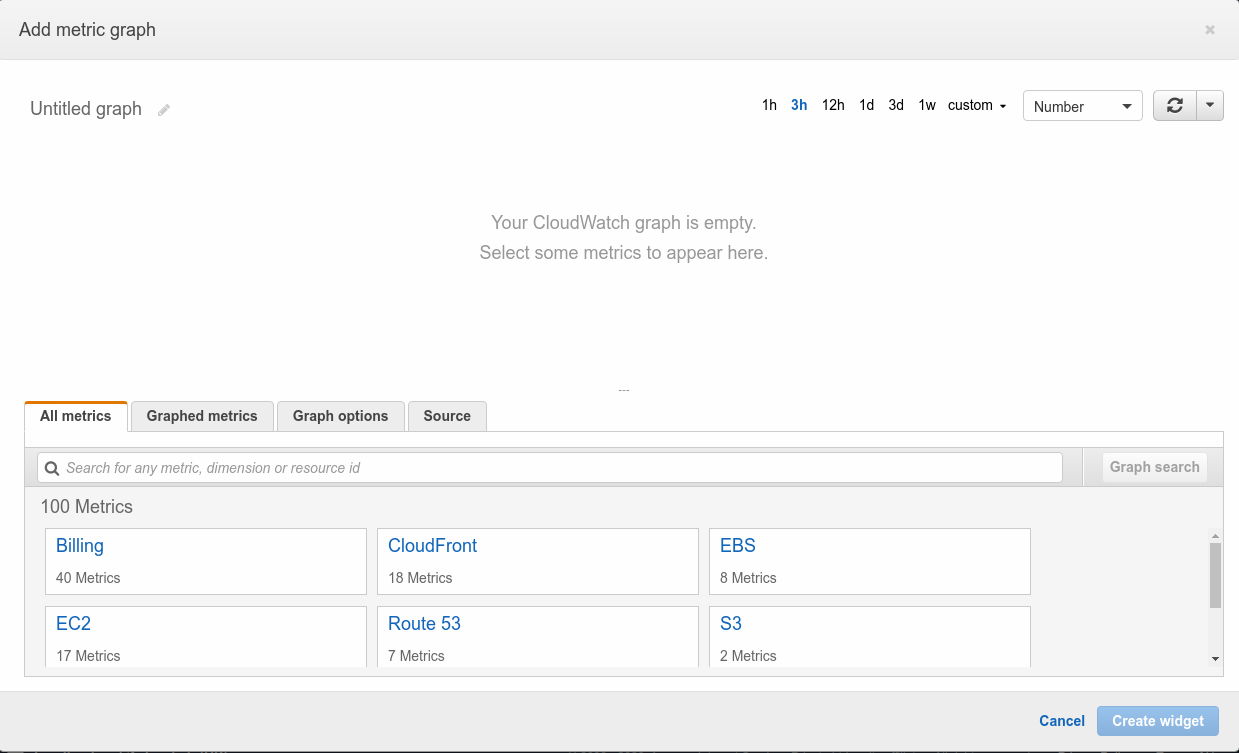
Now, we click on “EC2” from the metric options given below in the above shown screenshot.
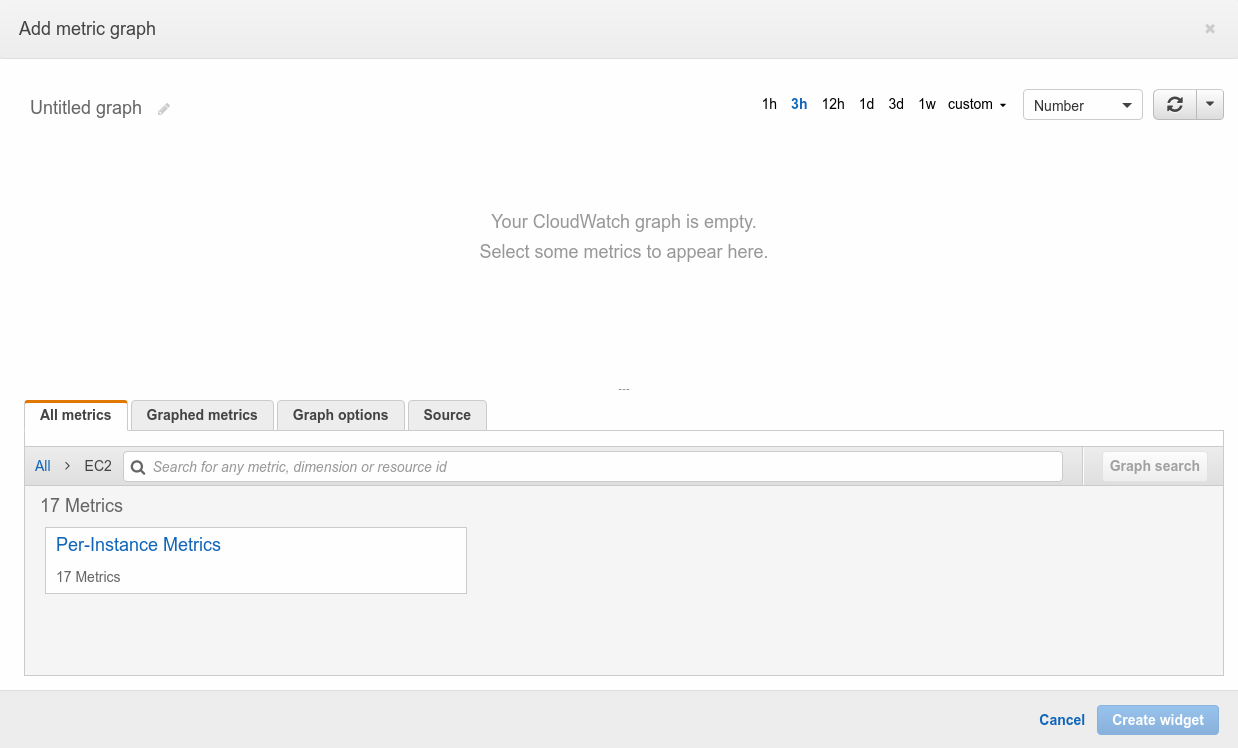
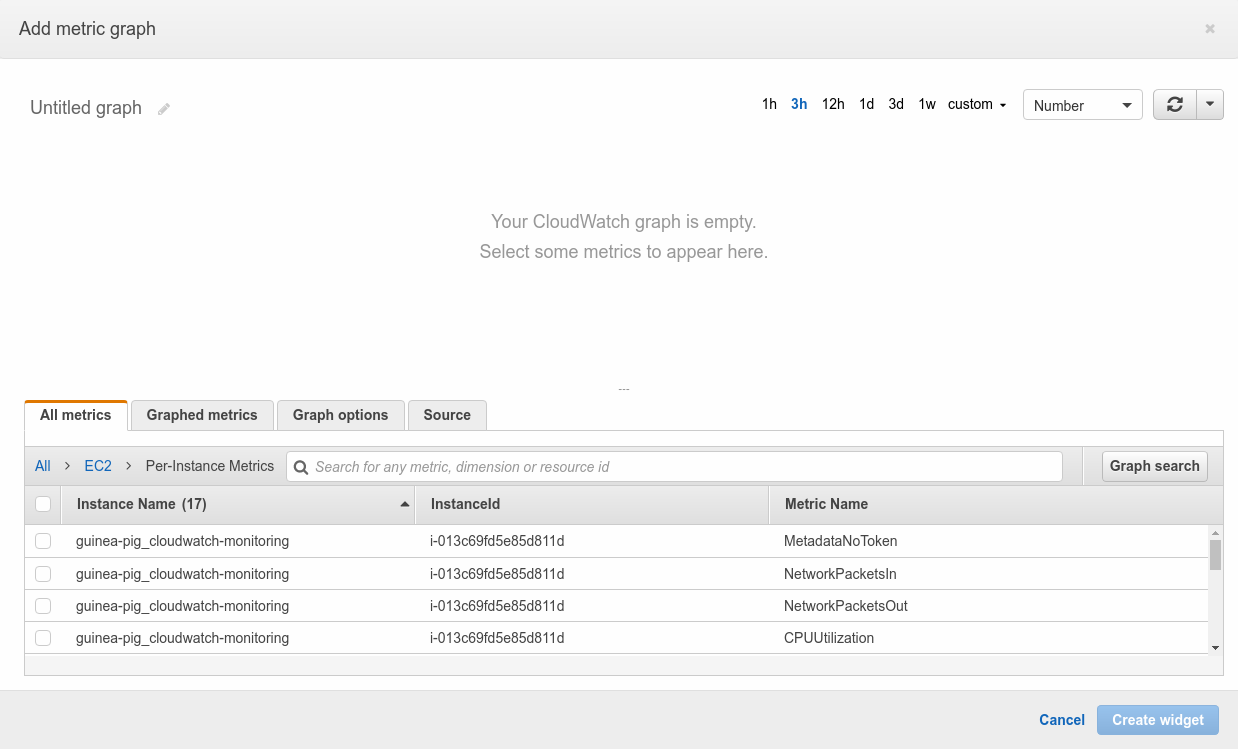
And we are now shown a “Per-Instance Metrics”, clicking on which takes us forward to a listing of available metrics for our instance ”guinea-pig_cloudwatch-monitoring” as shown in the second screenshot above.
Now, we scroll down till we find “CPUUtilization” and select it
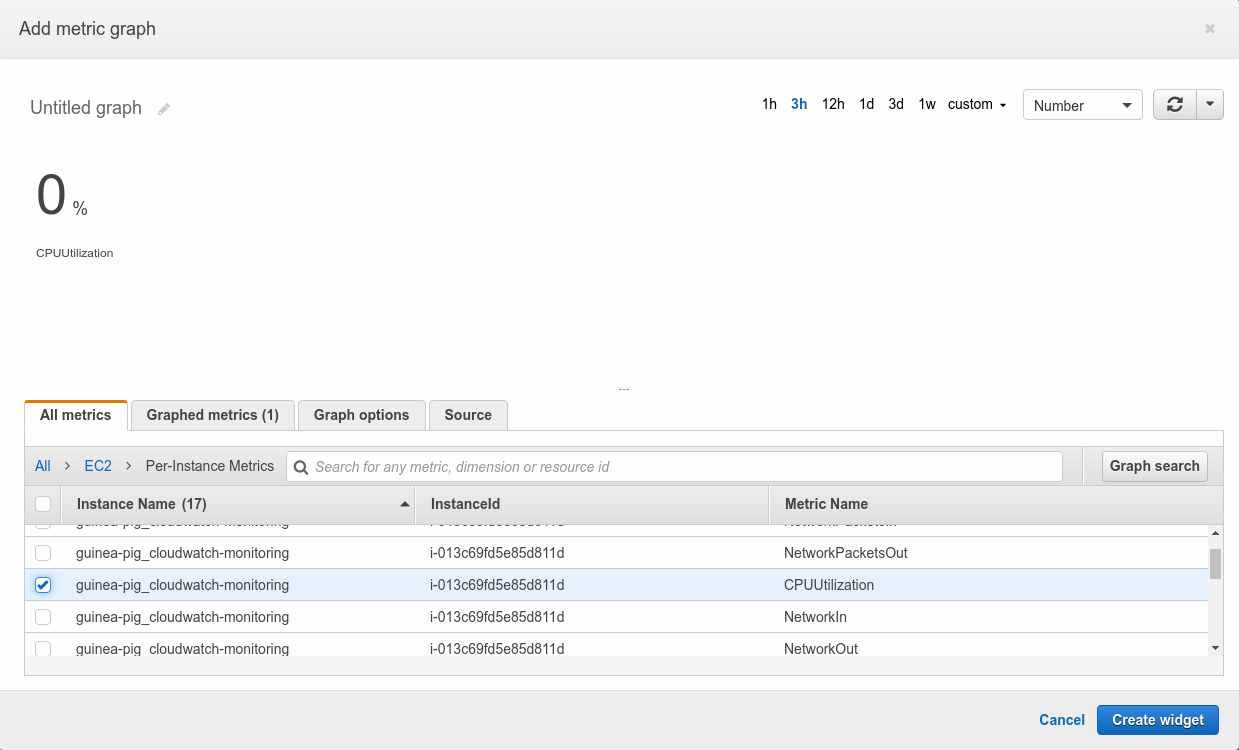
And we get the output as above, the % may differ according to the processes running in your instance as over here we are using an instance which has almost no process running inside it.
We click on “Graphed metrics (1)” and change the “Statistic” from “Average” to “Maximum”.

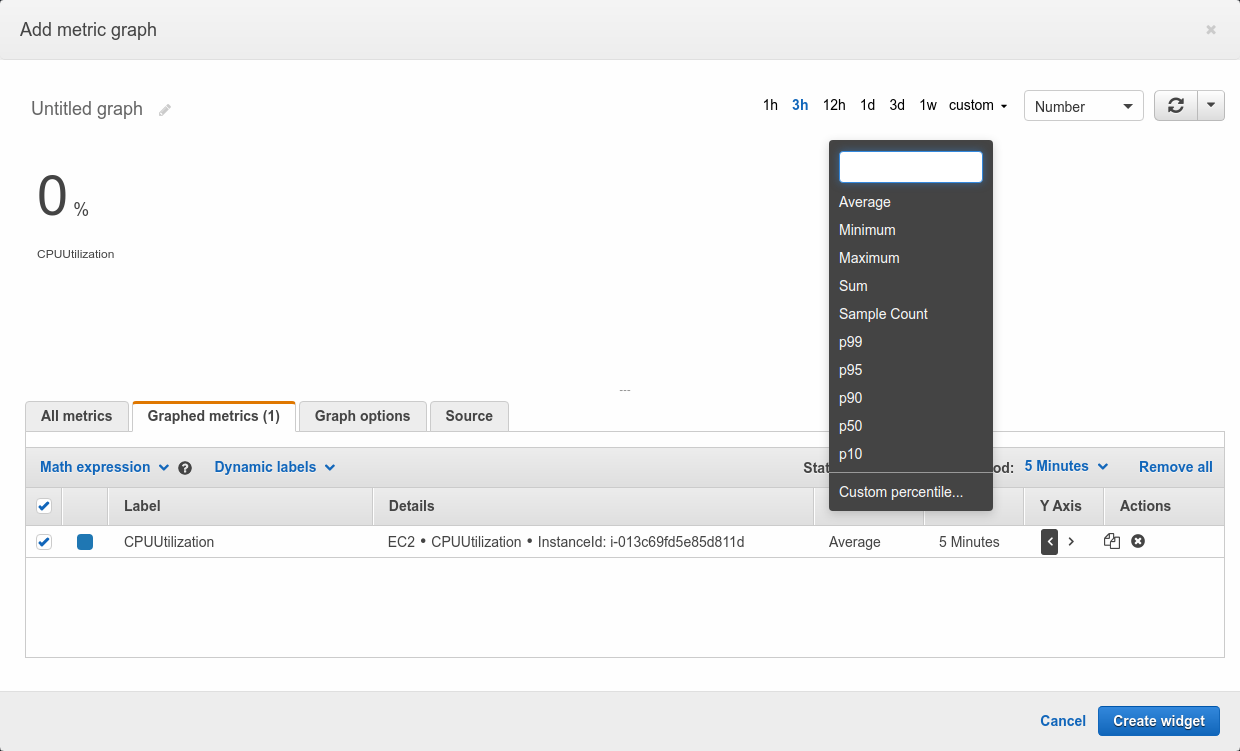
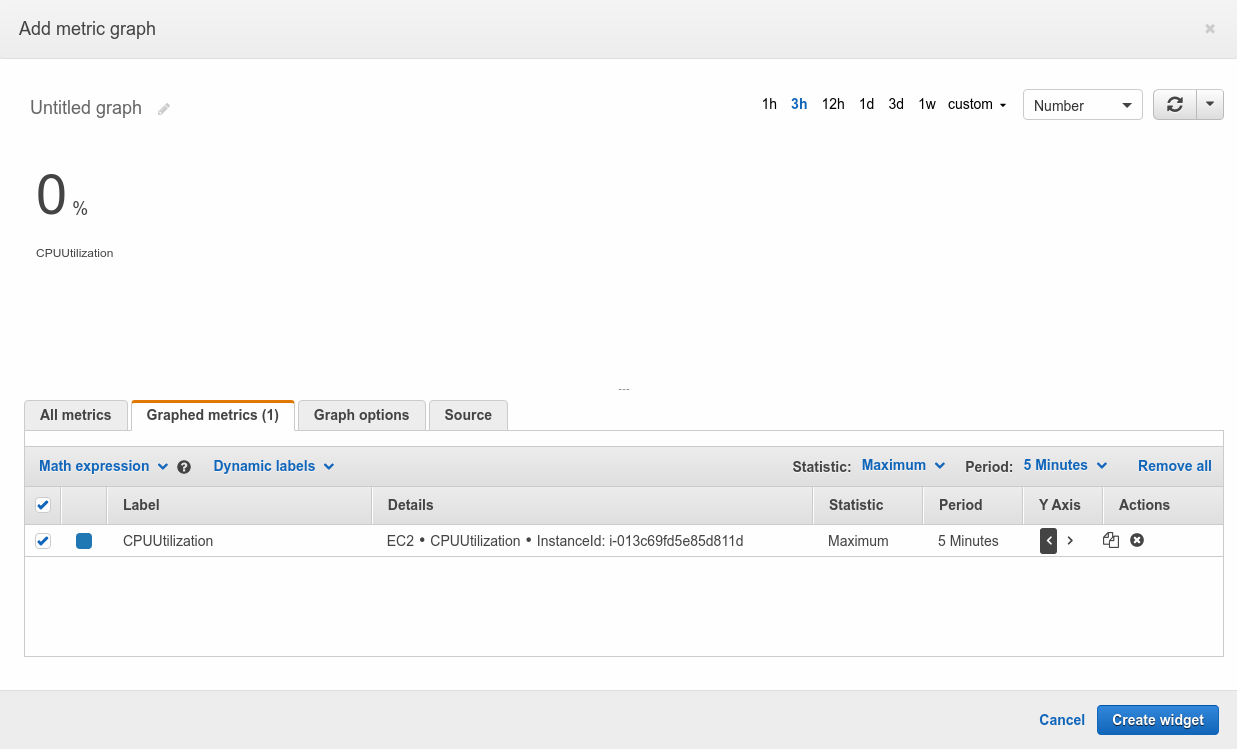
And then we will click on “Create widget”.
And we see a tile occupy some space in the dashboard.
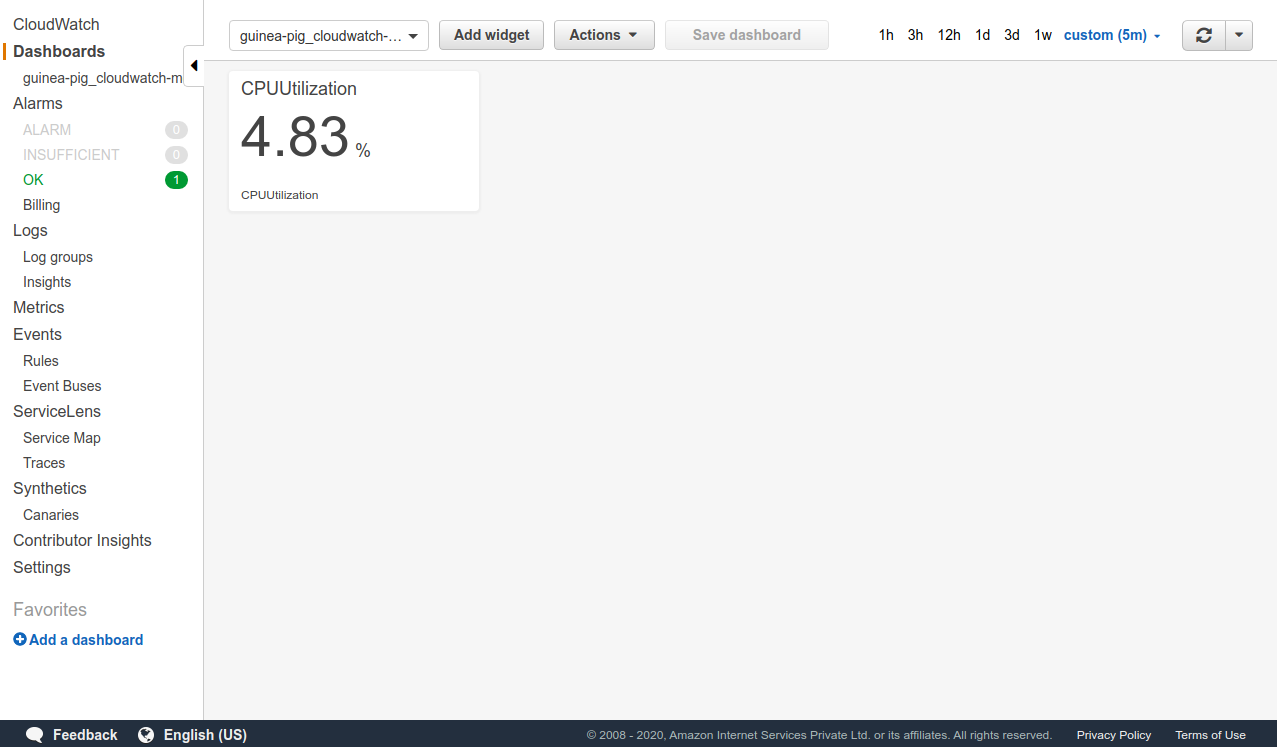
The same way you can create widgets to view metrics for respective available other 16 types of metrics (the meaning and reason behind the metric listed over here can be understood from this doc) :
->CPUCreditBalance
->CPUSurplusCreditBalance
->CPUSurplusCreditsCharged
->NetworkPacketsIn
->NetworkPacketsOut
->NetworkIn
->NetworkOut
->DiskReadBytes
->DiskWriteBytes
->DiskReadOps
->DiskWriteOps
->StatusCheckFailed_System
->StatusCheckFailed_Instance
->StatusCheckFailed
But, if you check we cannot still add widgets for both memory utilization as well as Disk-space utilization by default and if you research a bit, the reason behind this is that AWS considers it to be a privacy breach to check your Instance’s memory and Disk-Utilization as to check the amount of usage they would need to go through what services you are using in the instance as well as what kind of filenames and what is the size of files inside your Instance. However, you can enable watching these metrics by providing consent to such scans by installing cloudwatch-agent inside your instance which will periodically scan your Instance for multiple types of metrics and you can gain memory and disk-space data from that agent.
Why would anybody need such kind of metrics from their instance you think? Well consider this scenario where you are running a custom batch of code inside your instance and the code is somehow utilizing the RAM to its max available value. You right now are viewing this resource utilization by either ssh-ing into your Instance and running diagnostic commands or have some other way to do it but it needs you to access the Instance every time. If you enable these metrics :-
Long story short, Installing cloudwatch agent on your instance will ultimately open the doors for you to manage your Instance without the need to access your Instance for a majority of basic tasks as well as provide you with some detailed insight into the utilization of resources of your choice.
So, now we will SSH into our Guinea-pig and carry on the steps required to install and setup the cloudwatch agent, but before that we will install apache web-server into the Instance to be able to generate some cpu,ram usage.
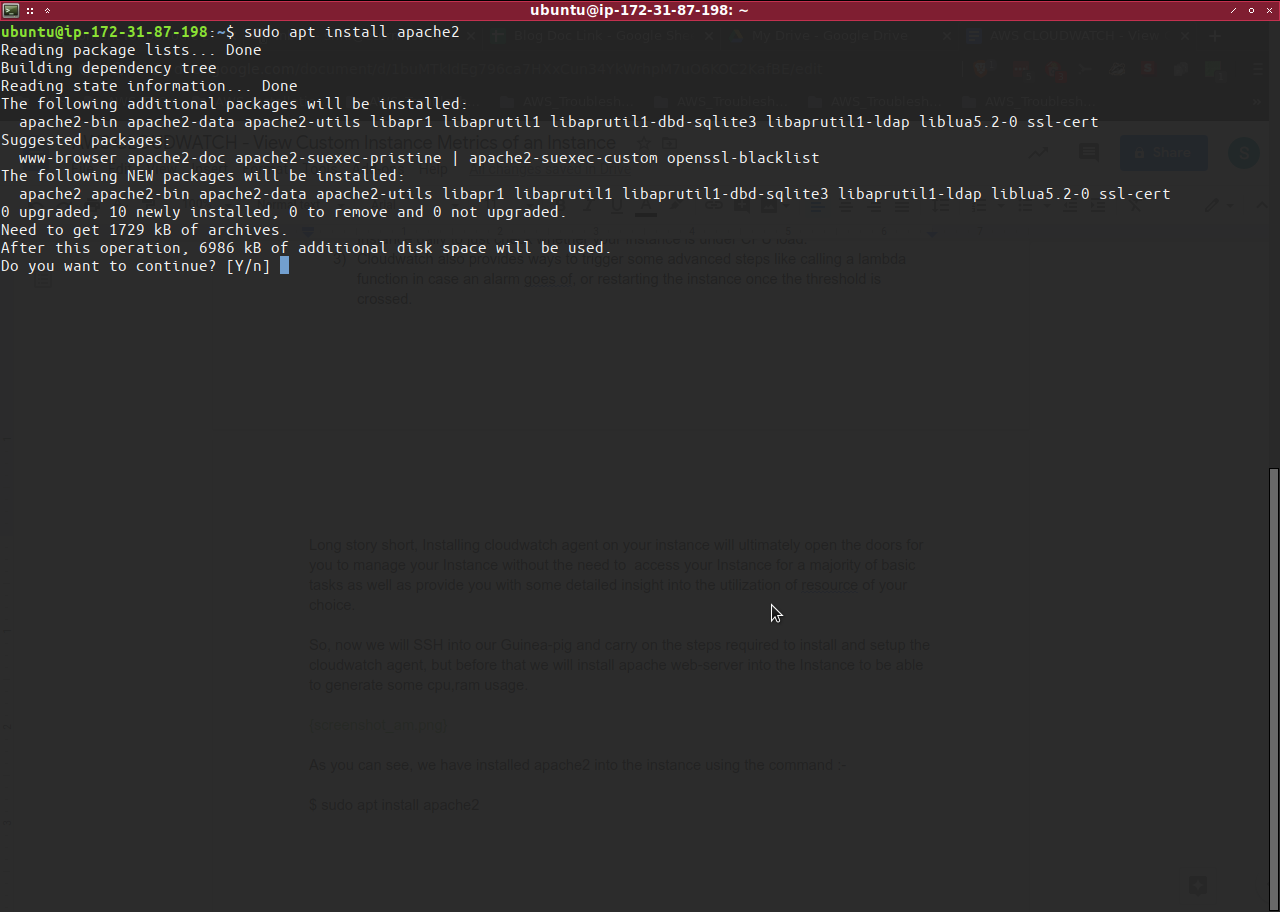
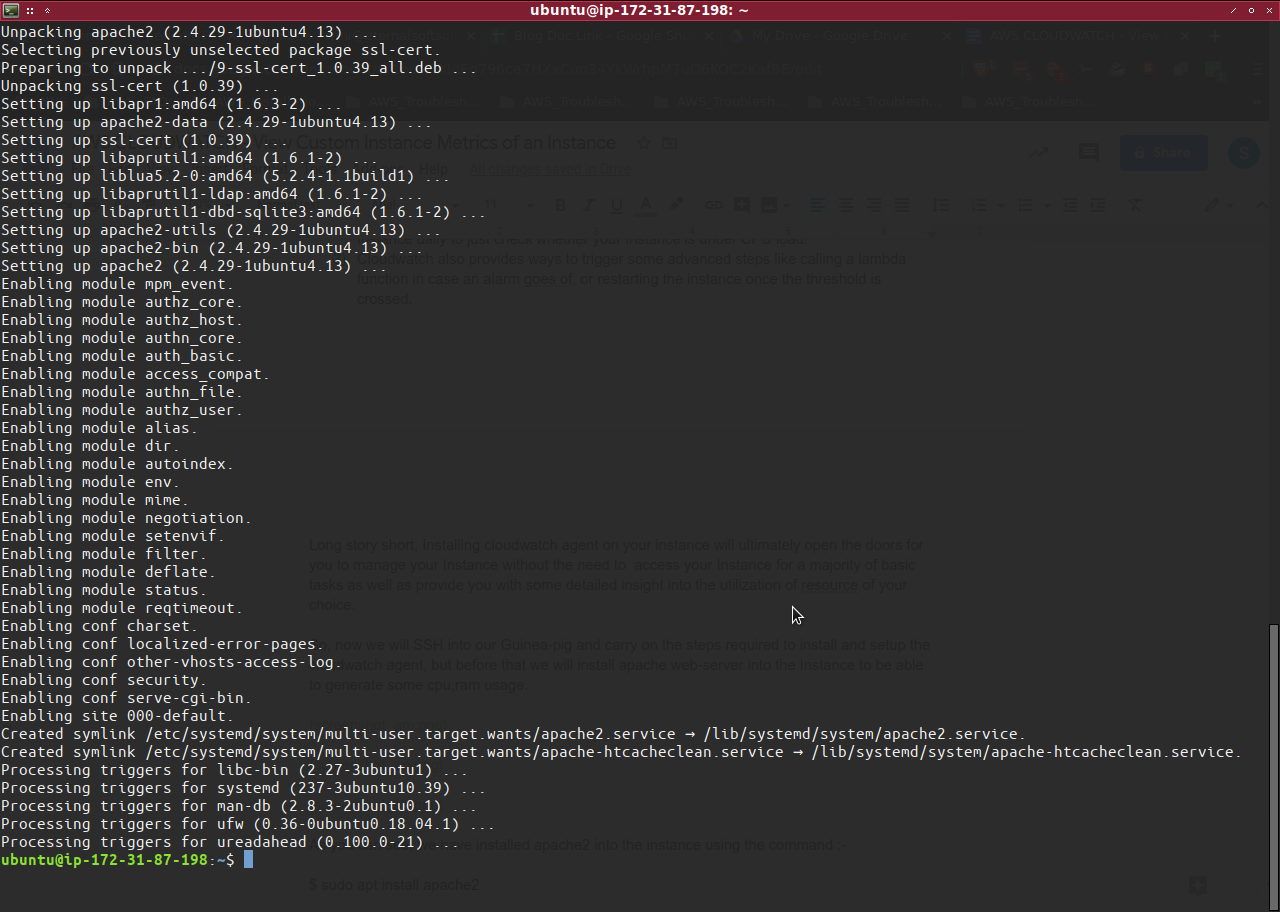
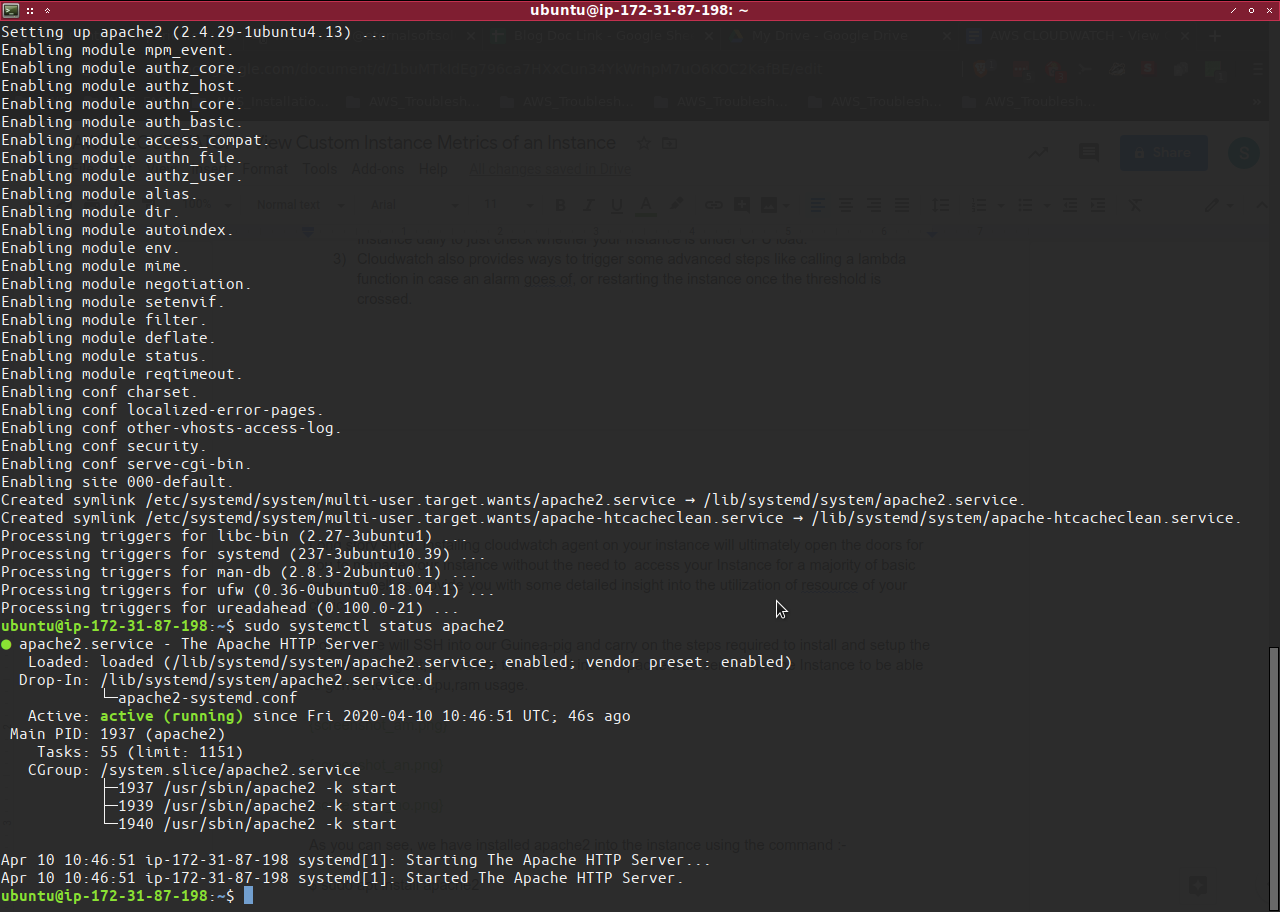
As you can see, we have installed apache2 into the instance using the command :-
$ sudo apt install apache2
And pressing a Y on being prompted to install the packages and then checking whether the apache service is running after installation by running the following command :-
$ sudo systemctl status apache2
Now, we will open the port 80 in security-groups for our http requests to be responded by apache server in the instance
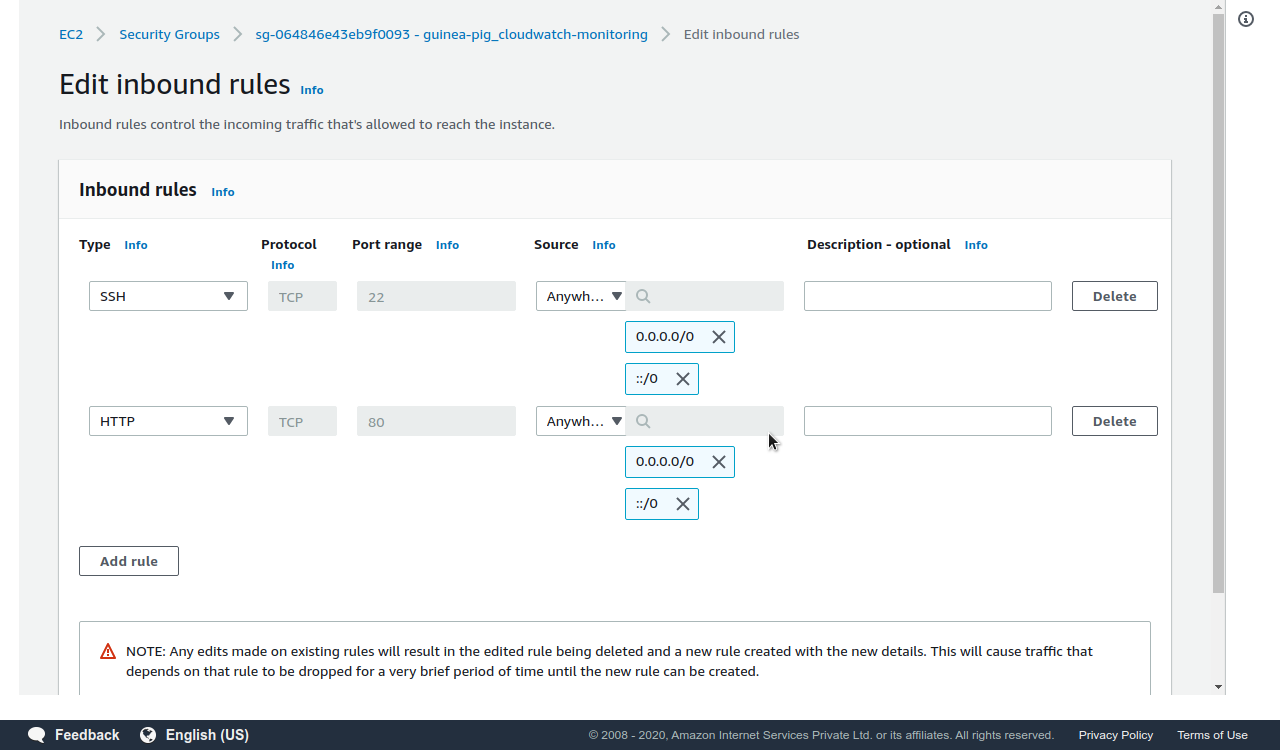
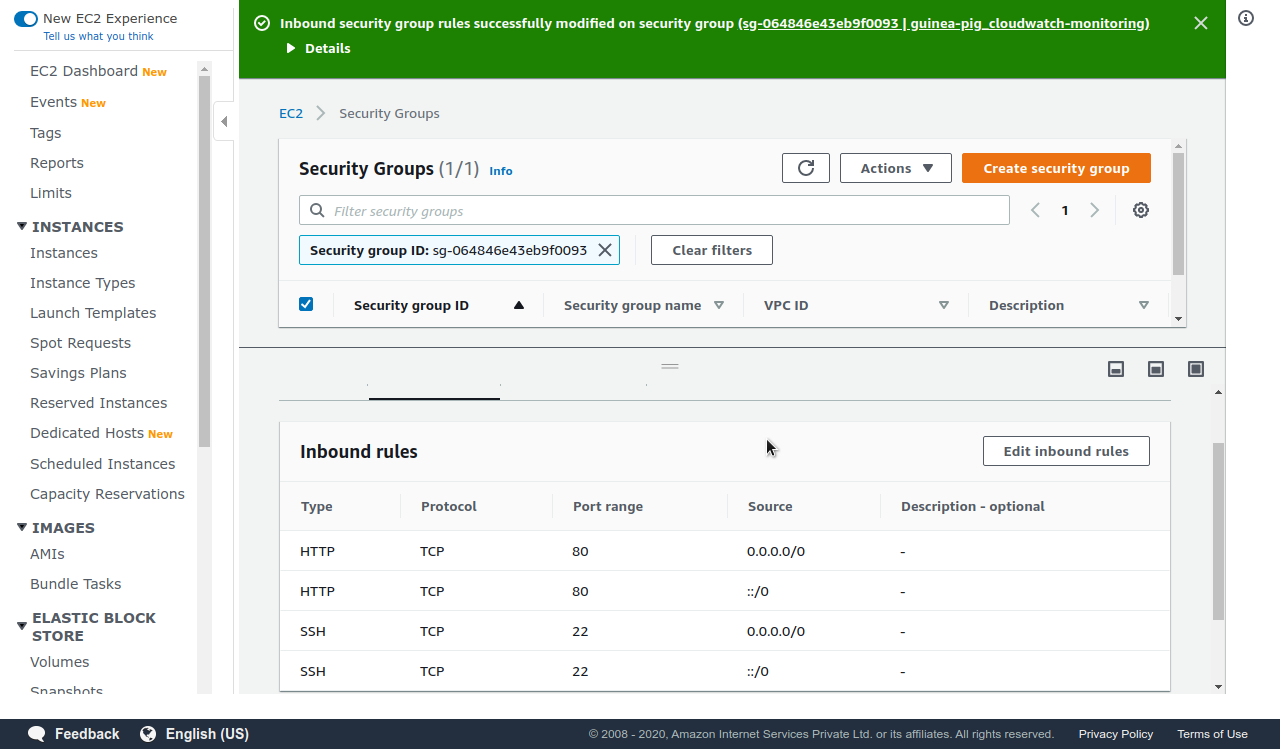
As shown in the screenshot we have opened the 80 port for the whole world.
Now, if we send http requests to our guinea-pig’s IP we would see the default apache2 page.
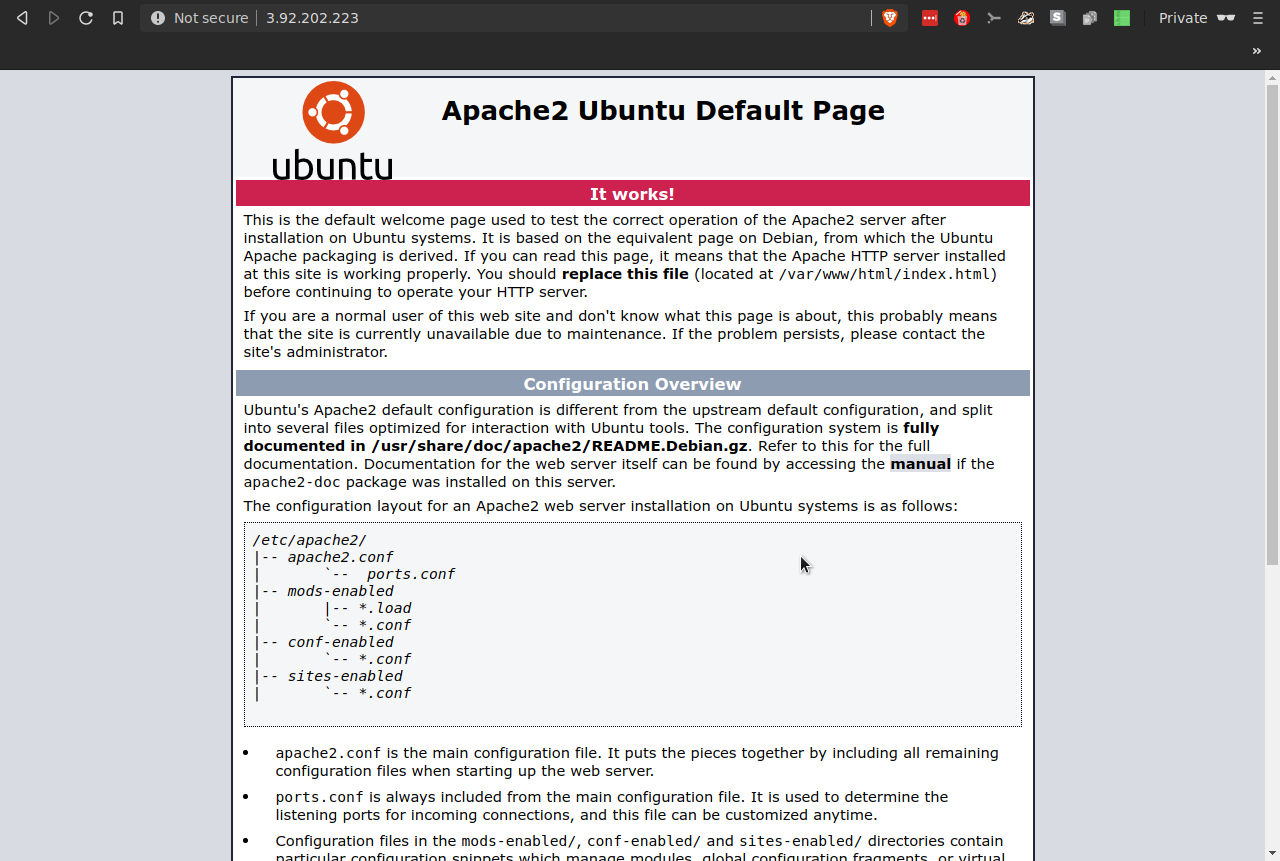
The Default apache2 web-page.
Now, we will install the cloudwatch-agent into our instance following this document.
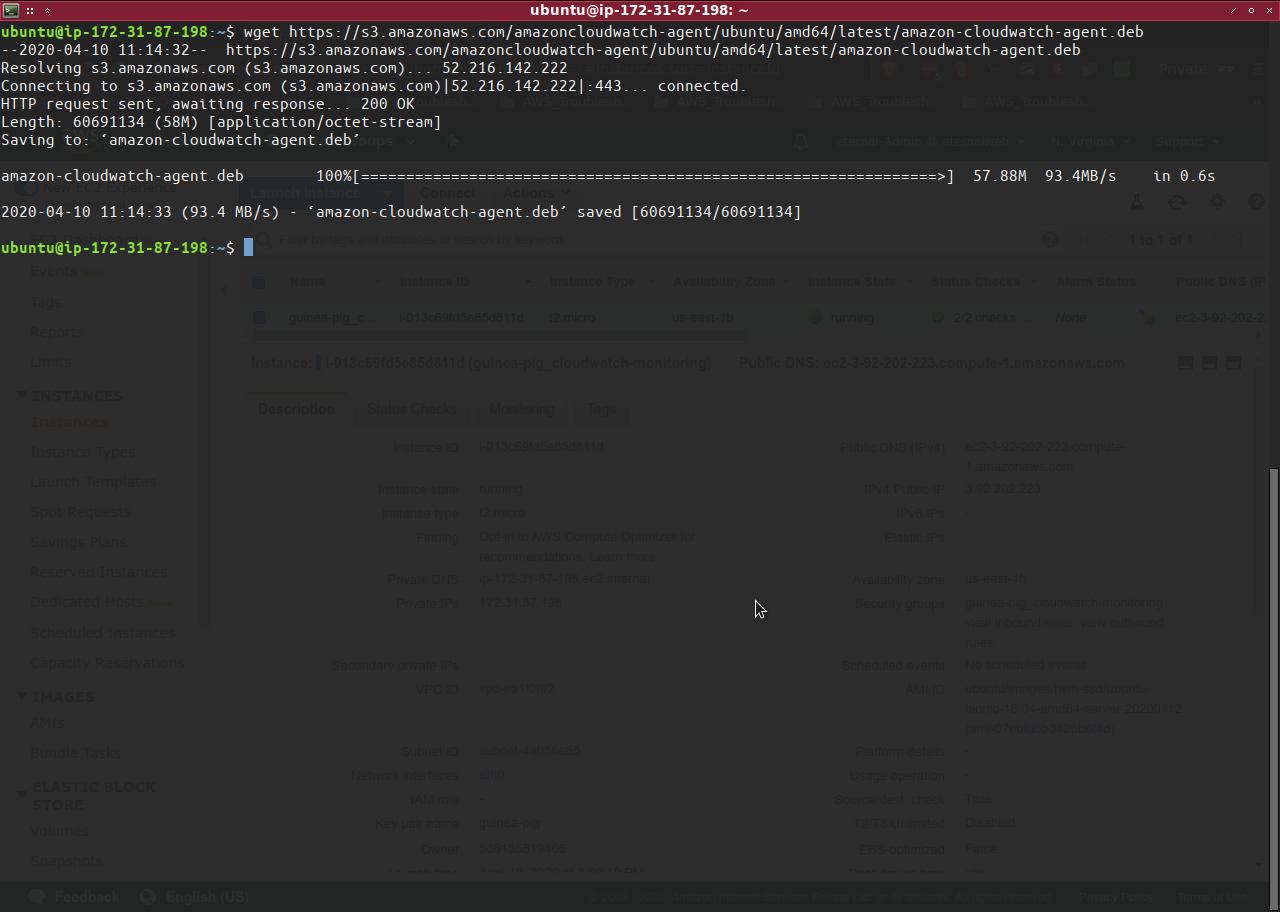
$ wget
https://s3.amazonaws.com/amazoncloudwatch-agent/ubuntu/amd64/latest/amazon-cloudwatch-agent.deb
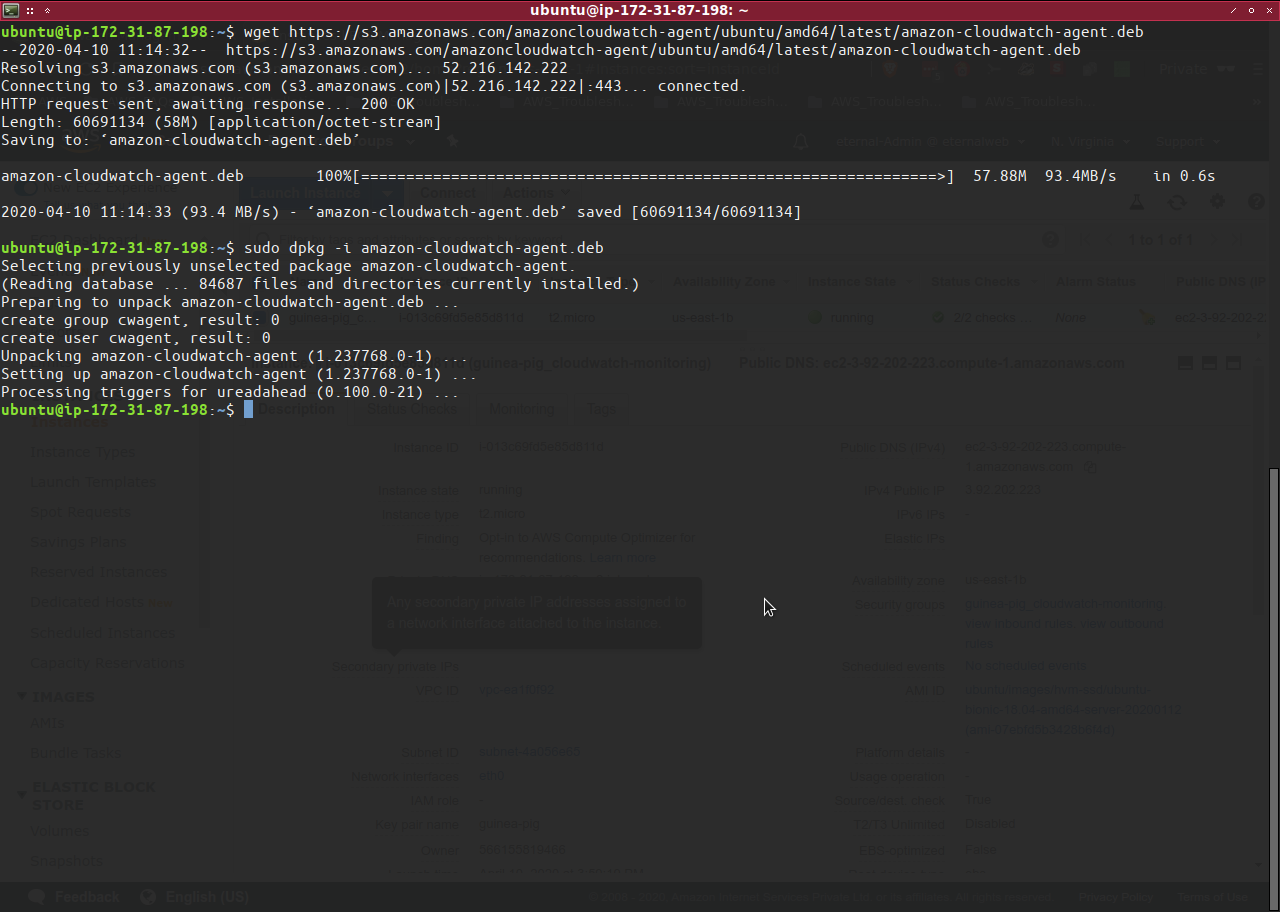
$ sudo dpkg -i amazon-cloudwatch-agent.deb
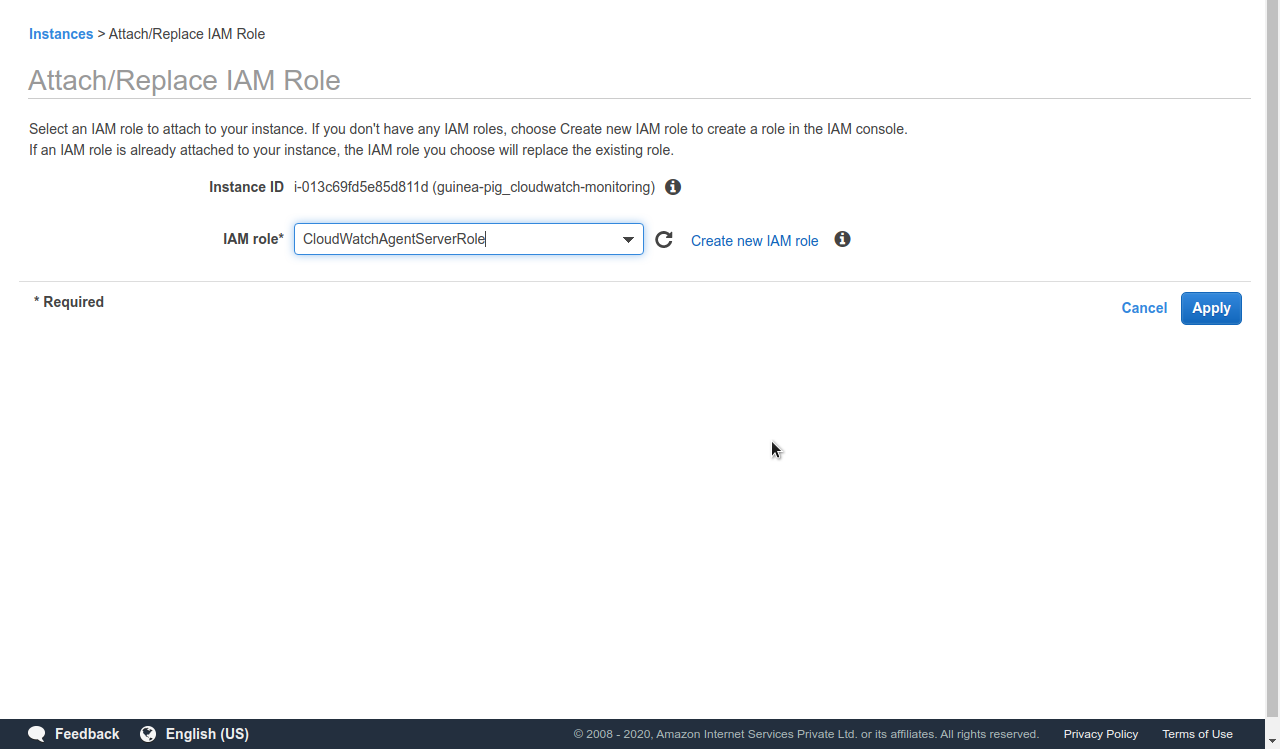
Next you need to attach an IAM Role to the running Instance by creating the Role following this documentation and attaching the IAM Role to the Instance.
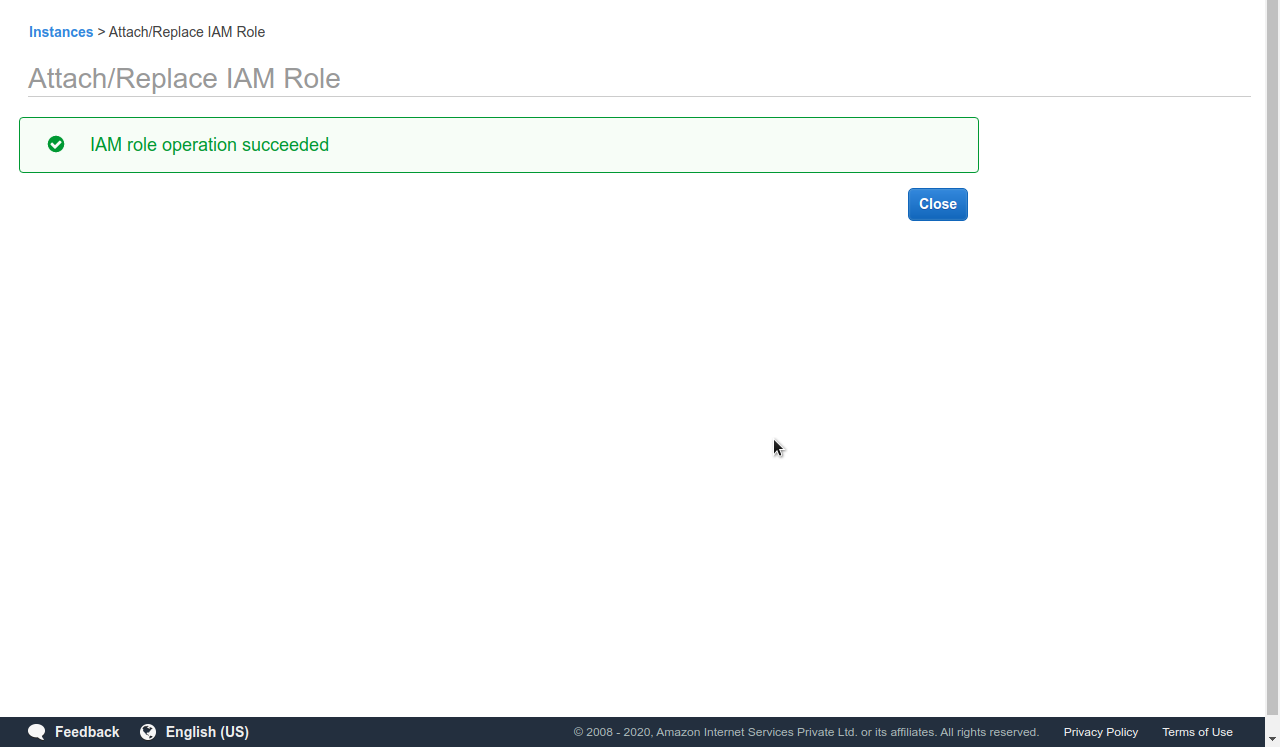
Once the installation has been successfully done we will move forward to creating the CloudWatch Agent Configuration File following this documentation.
We will Run the CloudWatch Agent Configuration Wizard following this documentation.
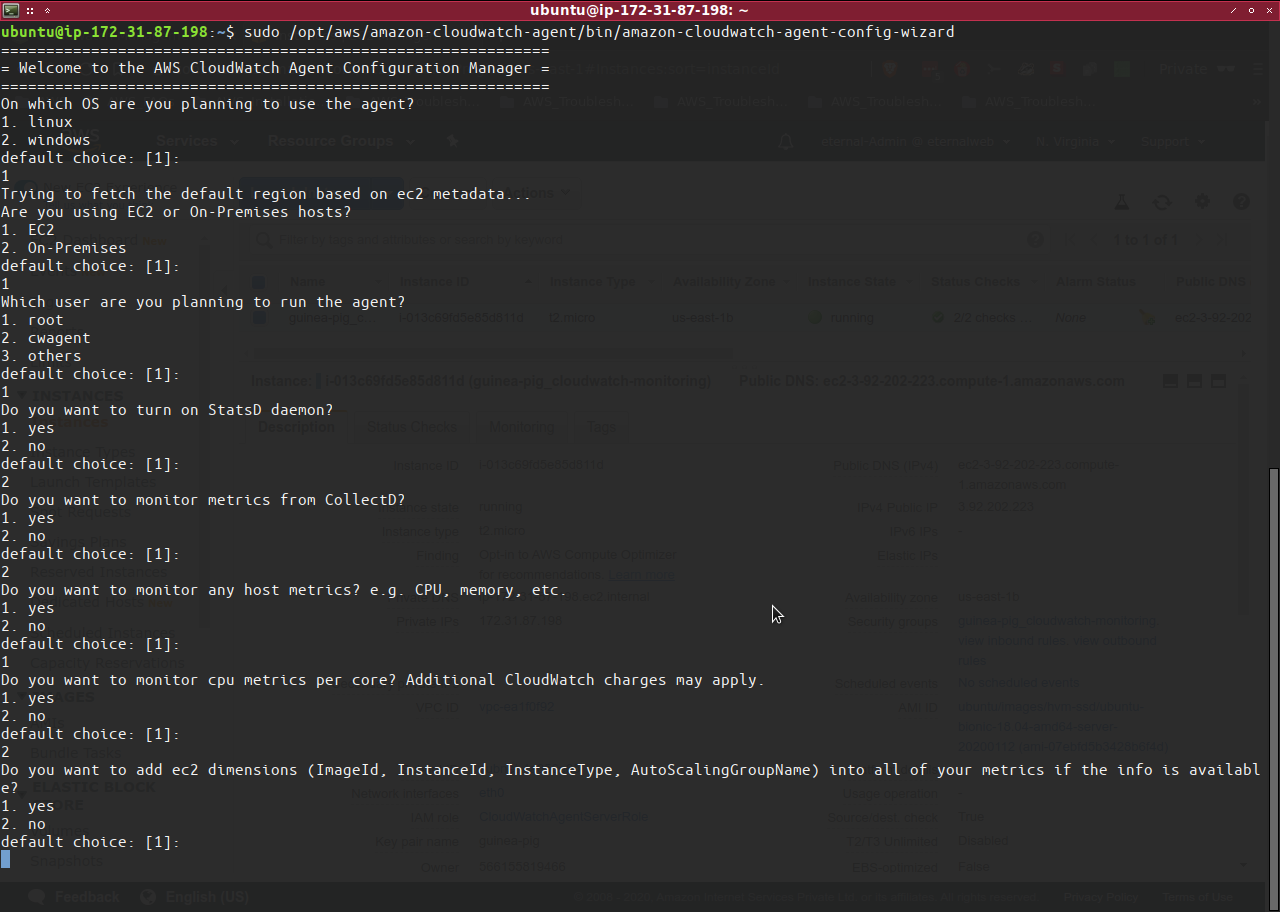
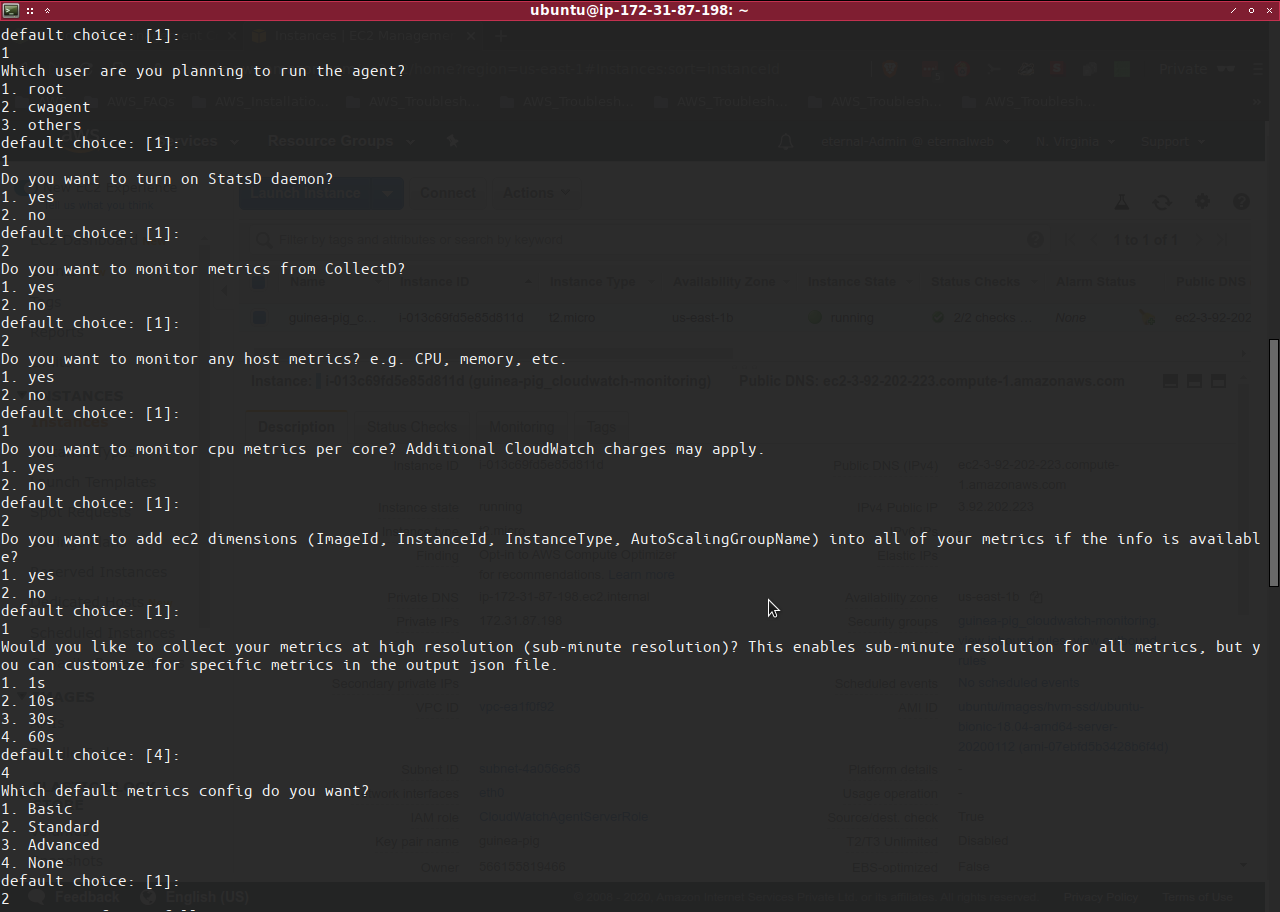
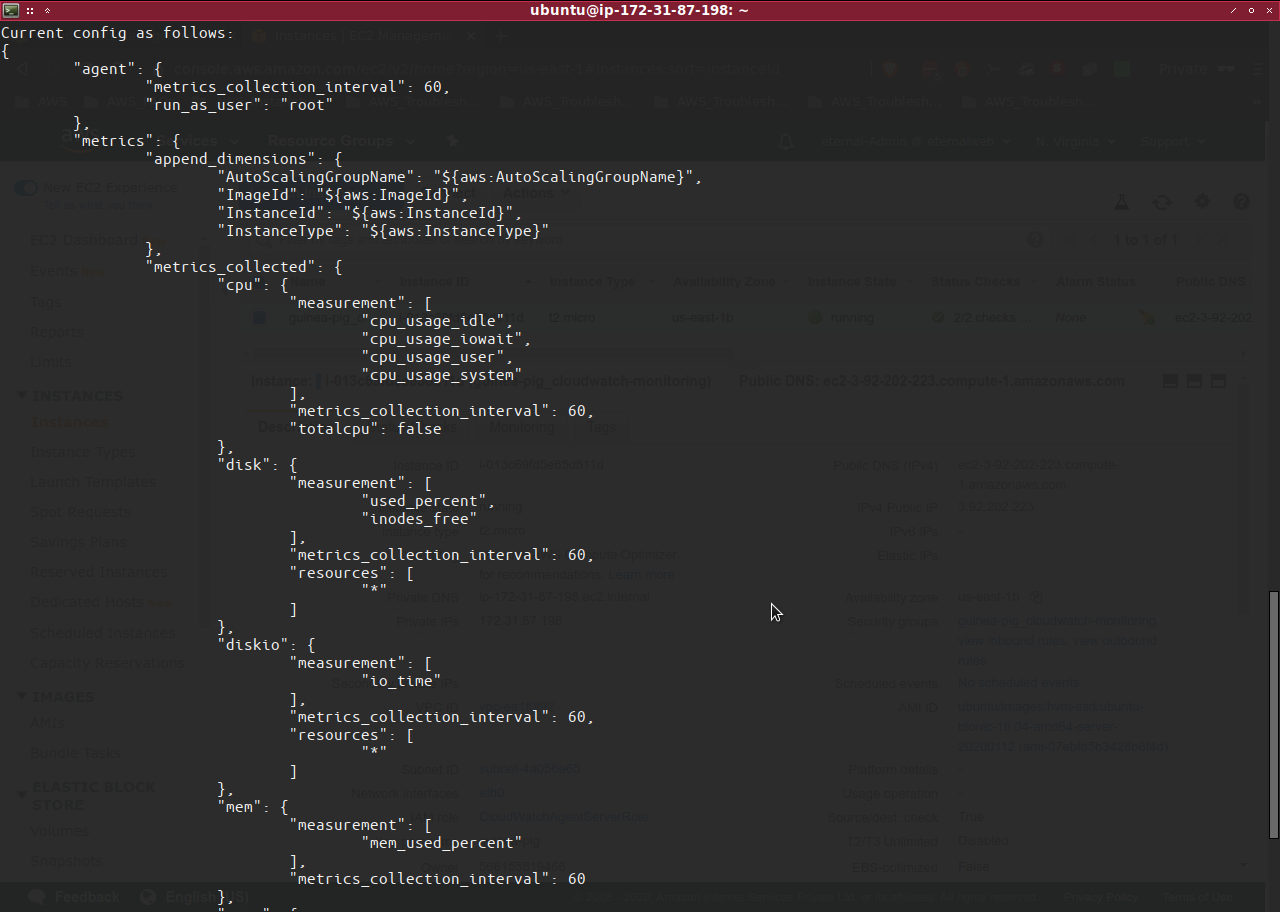
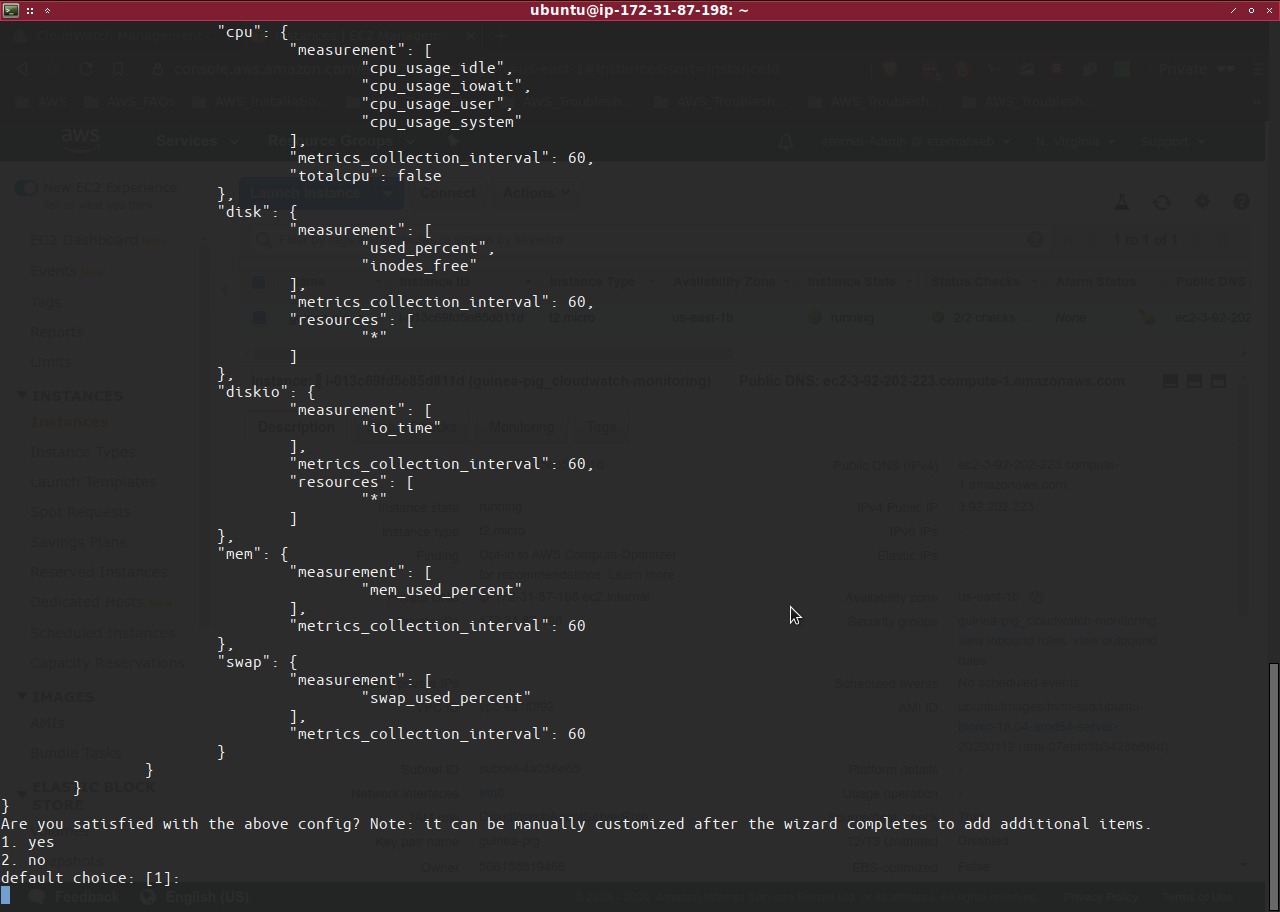
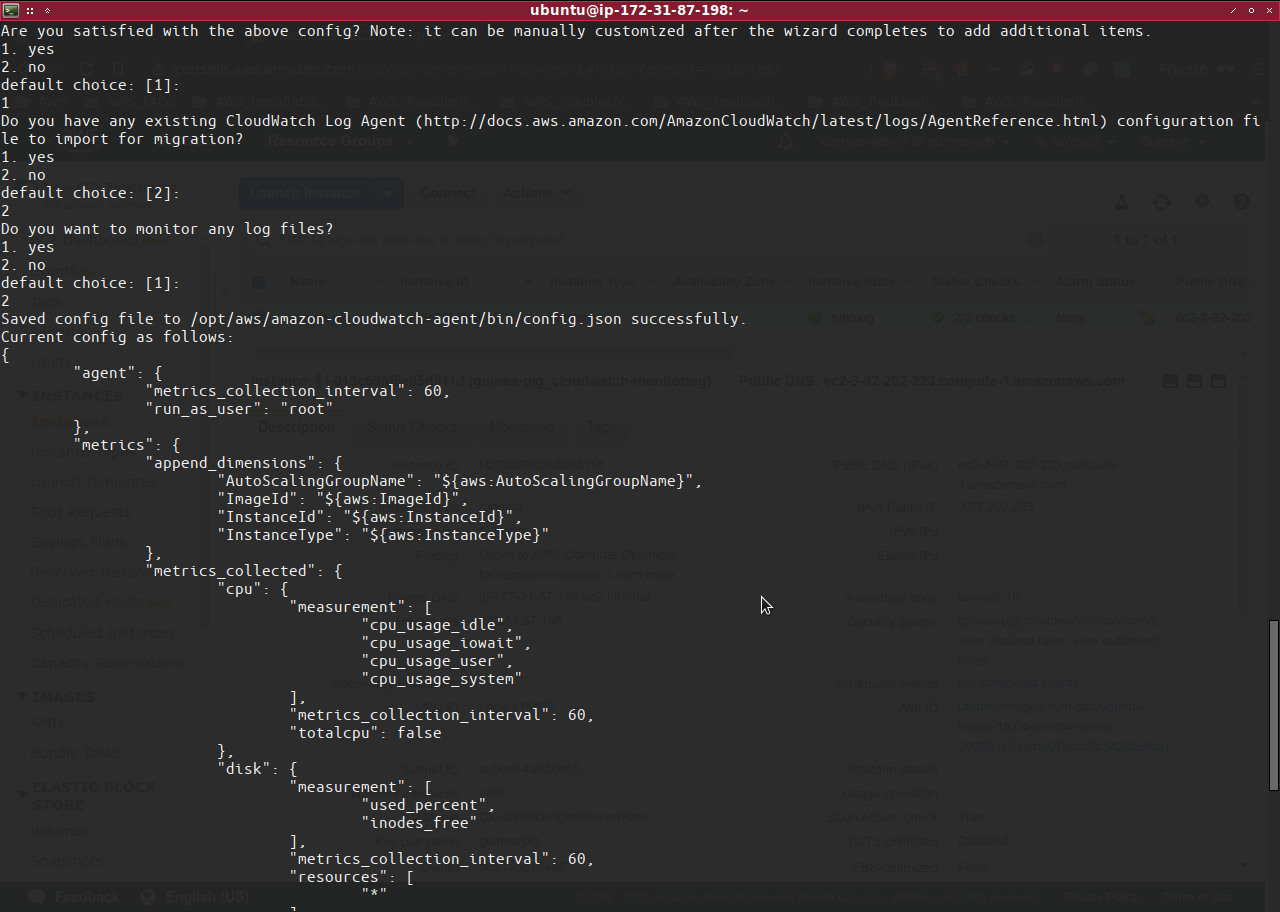
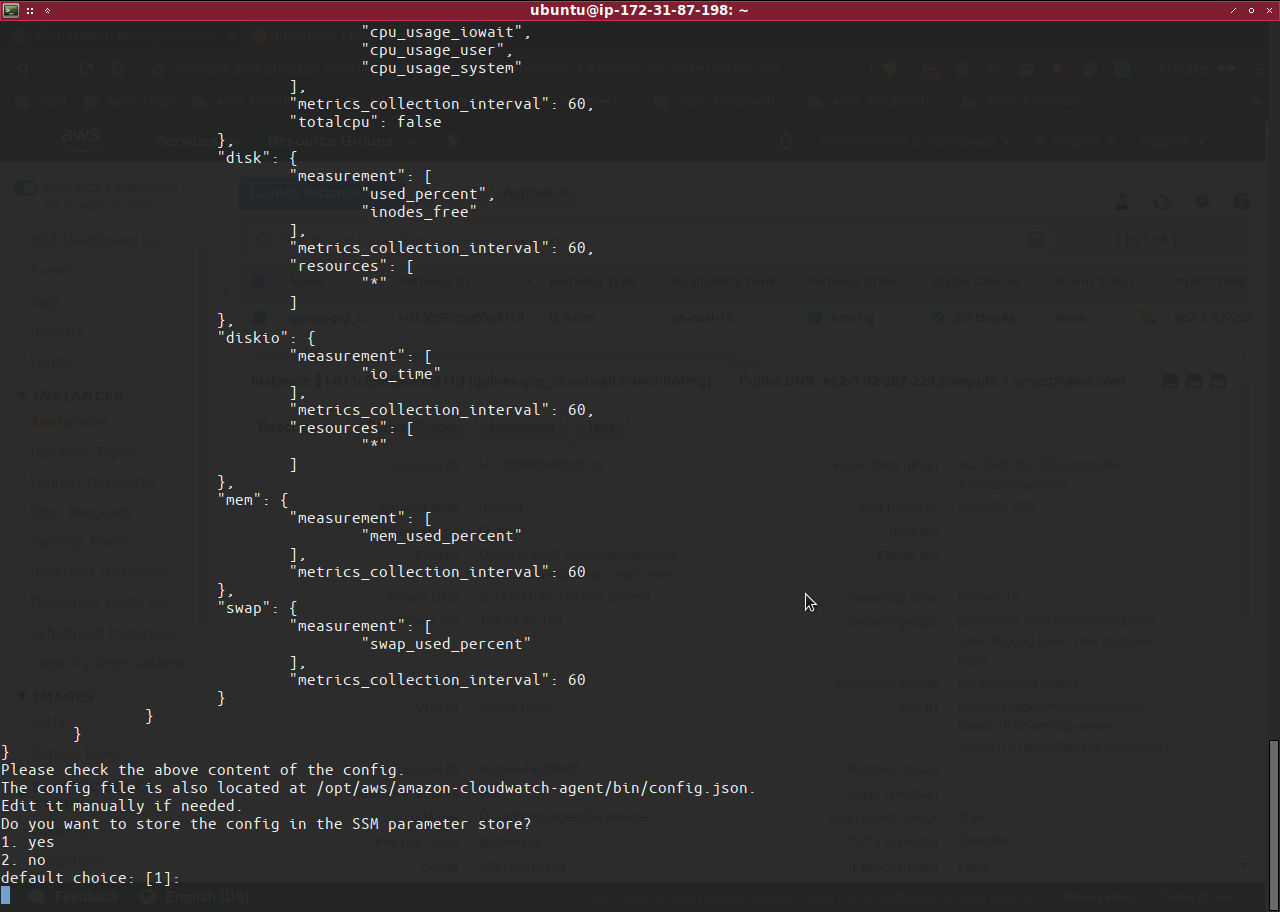
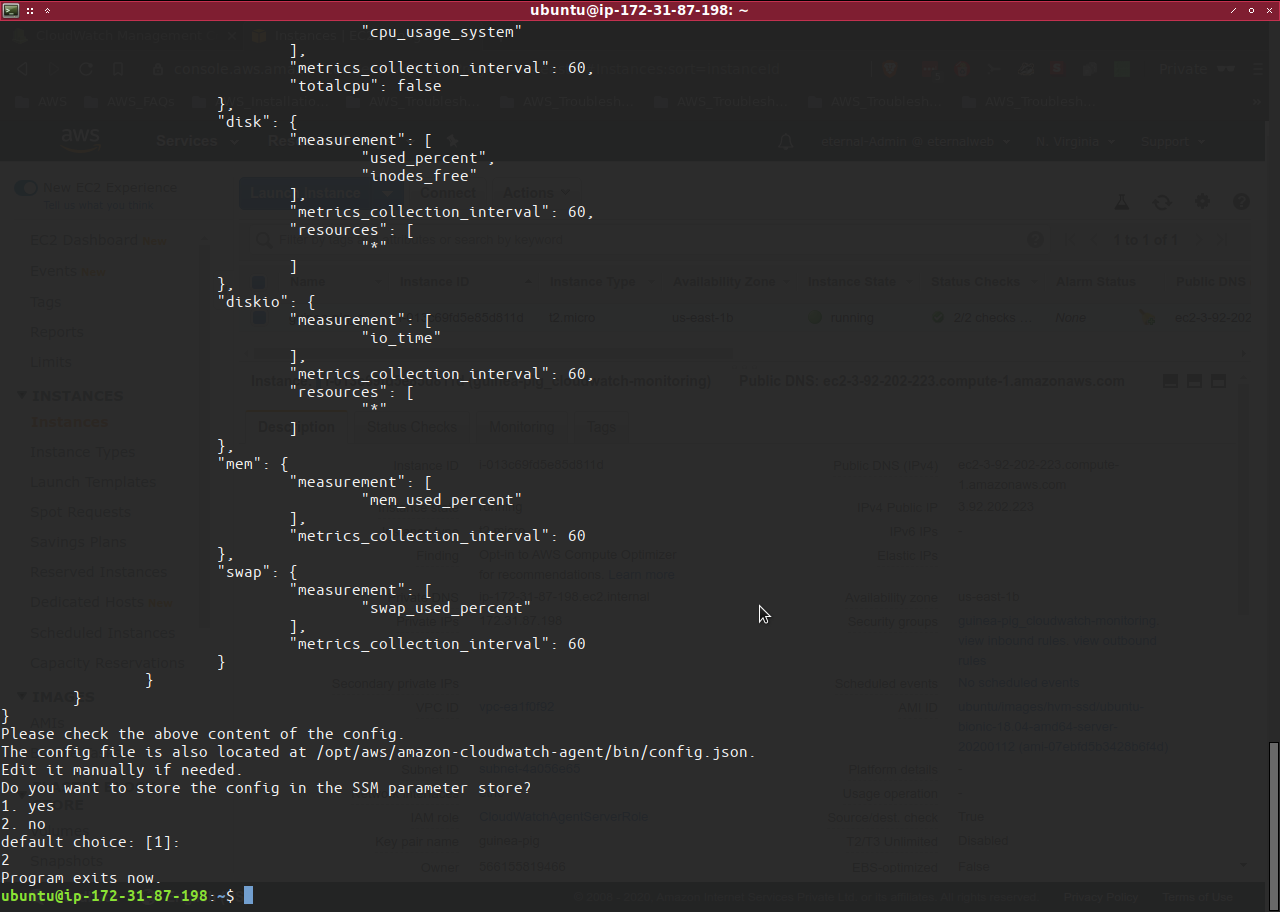
$ sudo /opt/aws/amazon-cloudwatch-agent/bin/amazon-cloudwatch-agent-config-wizard
In the screenshots shown above we have answered the questions to customize the configuration file for our server. You can change the answers to the questions according to your personal requirements.
The config file is stored in the file-path “/opt/aws/amazon-cloudwatch-agent/bin/config.json”.
We will now start the cloudwatch agent using the following command.
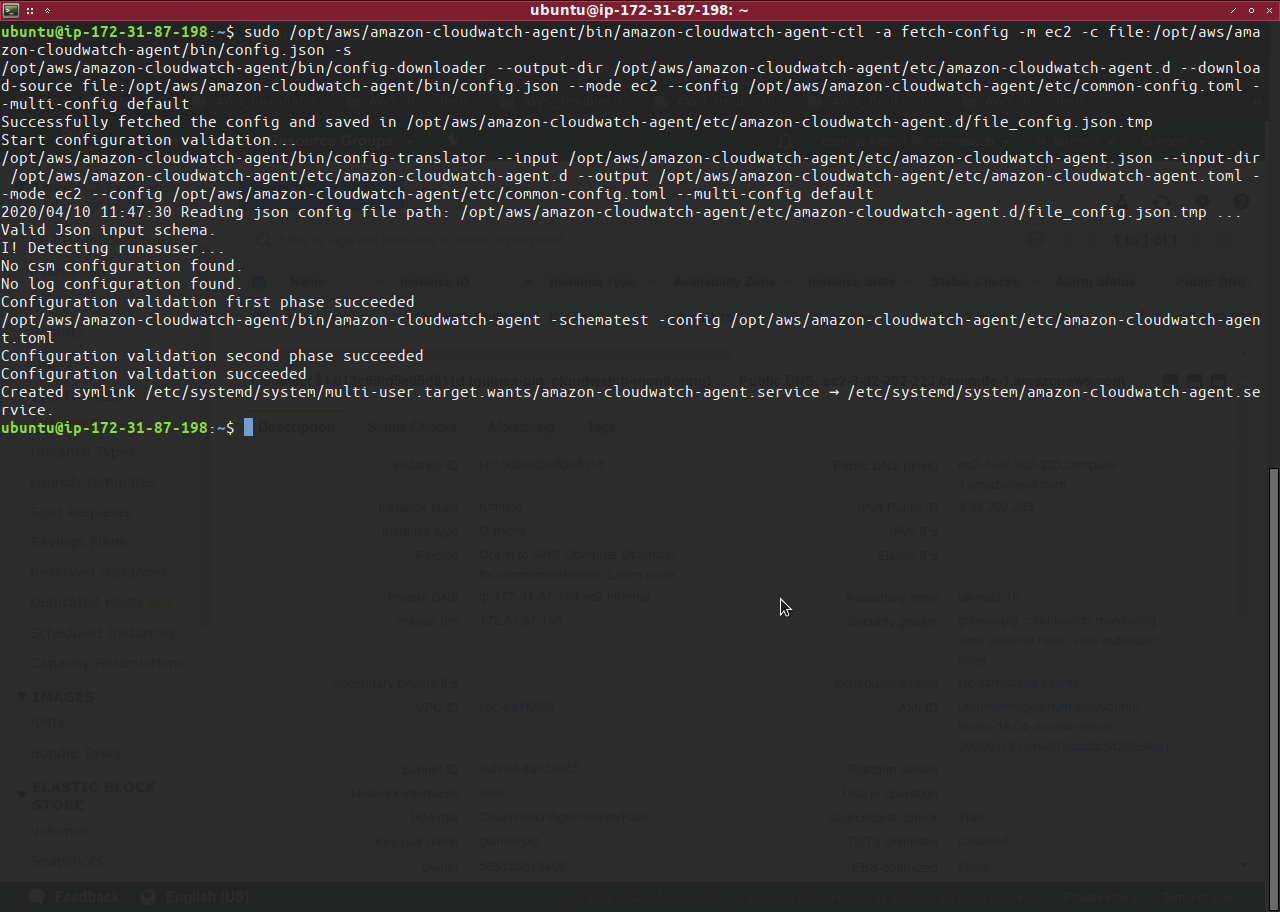
sudo /opt/aws/amazon-cloudwatch-agent/bin/amazon-cloudwatch-agent-ctl -a fetch-config -m ec2 -c file:/opt/aws/amazon-cloudwatch-agent/bin/config.json -s
Once this is done, we can go back to the Cloudwatch Console and check to see some changes :
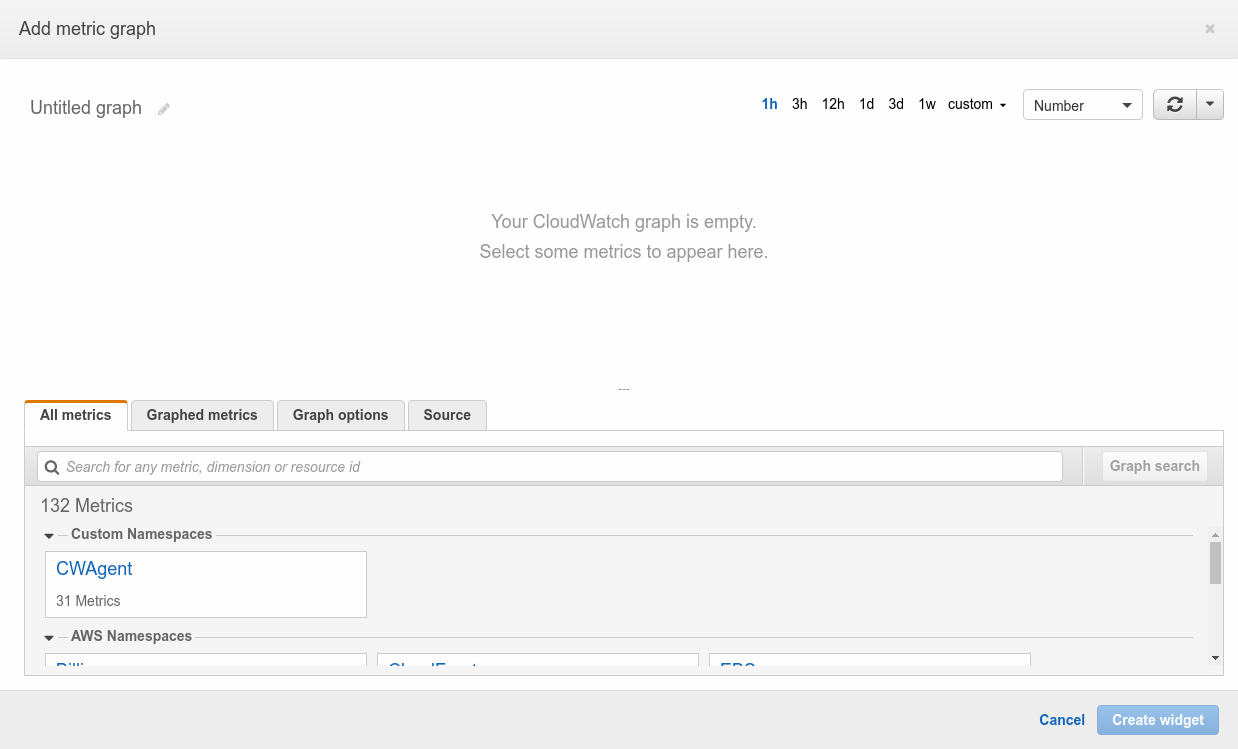
Now, you can see a new tile when we click on “Add widget” to see “CWAgent”. This tile is being shown because cloudwatch agent service ran successfully inside of our guinea-pig and if you are unable to view the “CWAgent” tile please repeat the steps from installation and setup of cloudwatch agent.
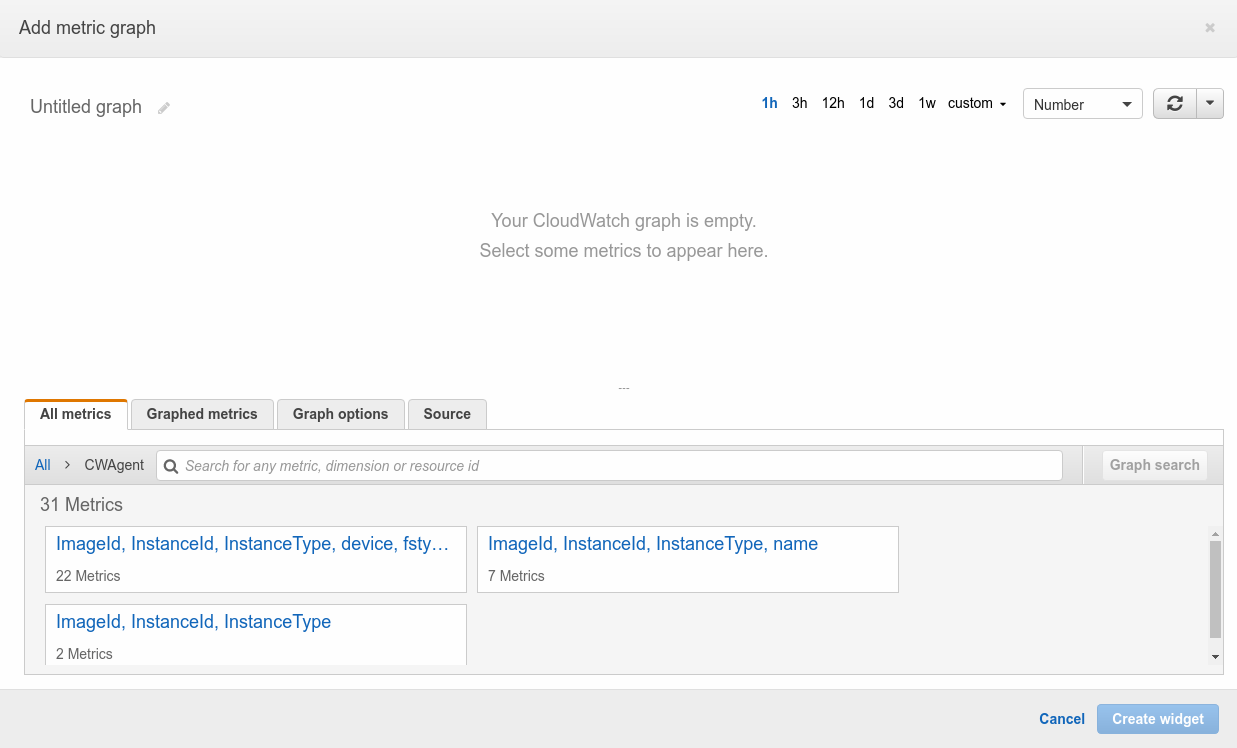
When we click on it we are shown 3 other tiles with identical names but with different no. of metrics.
-> 1st with 22 Metrics
-> 2nd with 7 Metrics
-> 3rd with 2 Metrics
We will choose the last tile with 2 Metrics
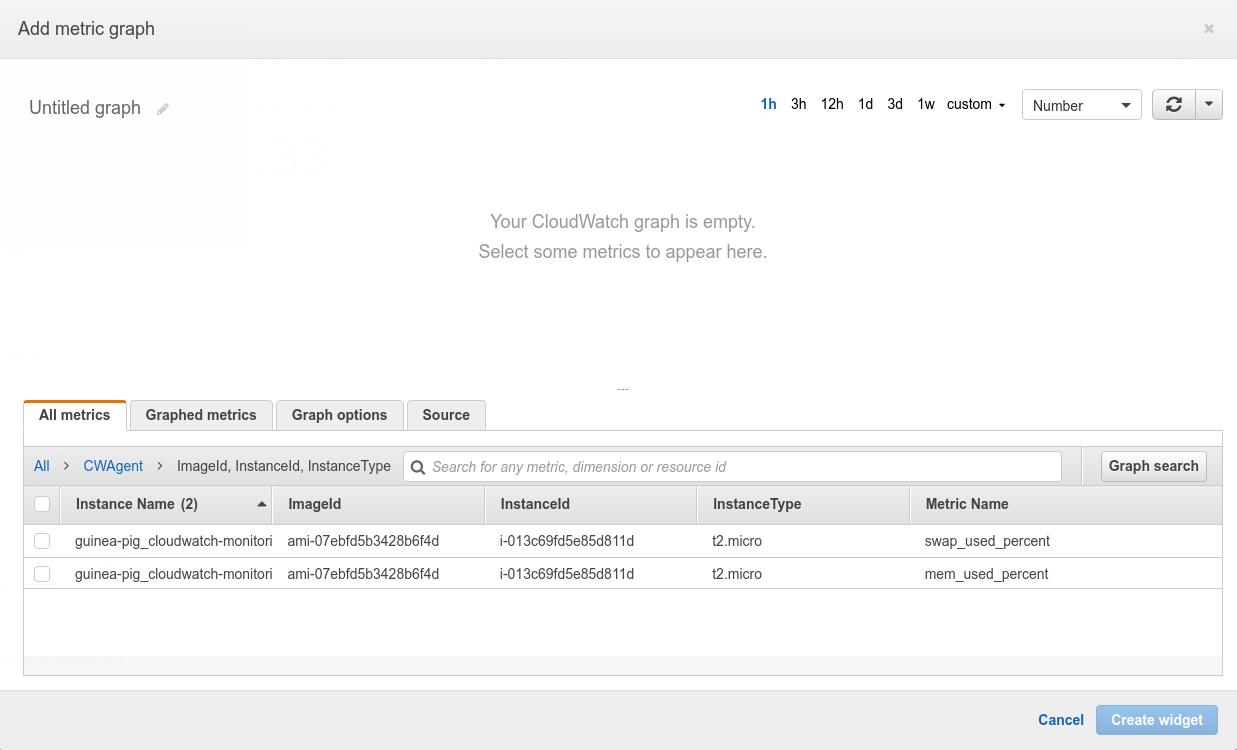
On clicking we get 2 Metrics options “swap_used_percent” and “mem_used_percent”
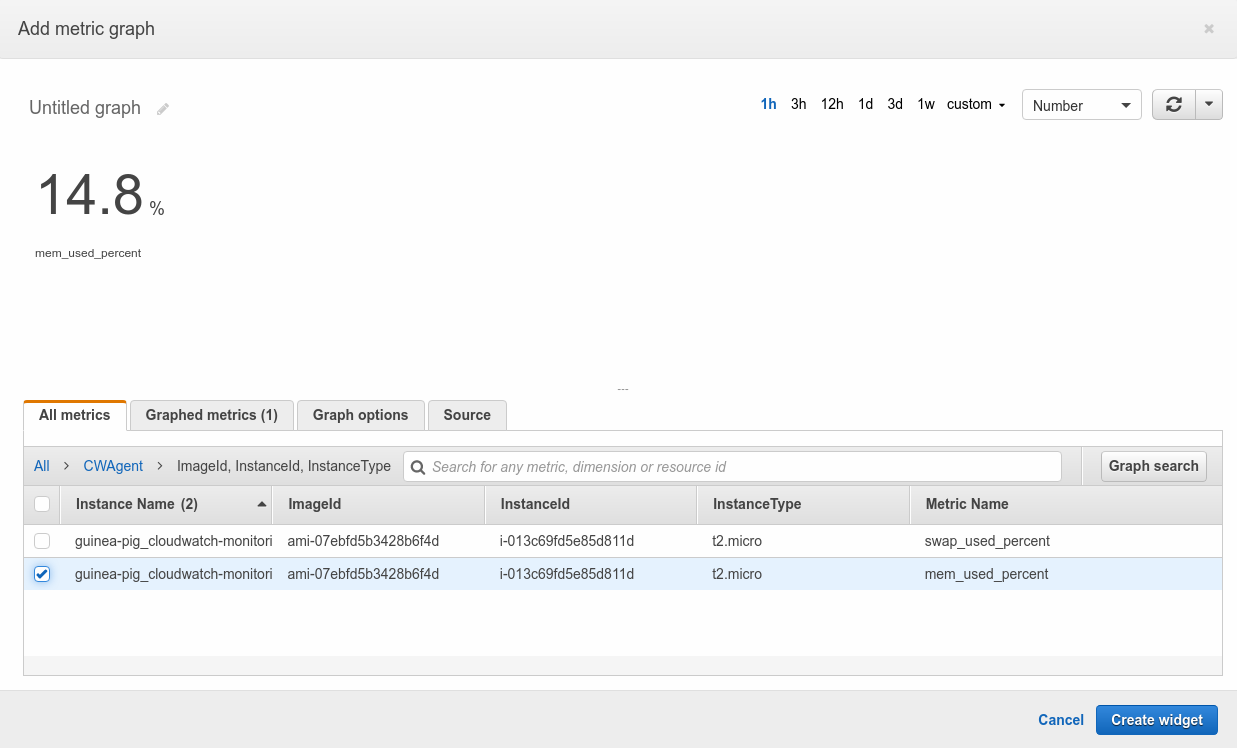
We will select 2nd Metric named “mem_used_percent”
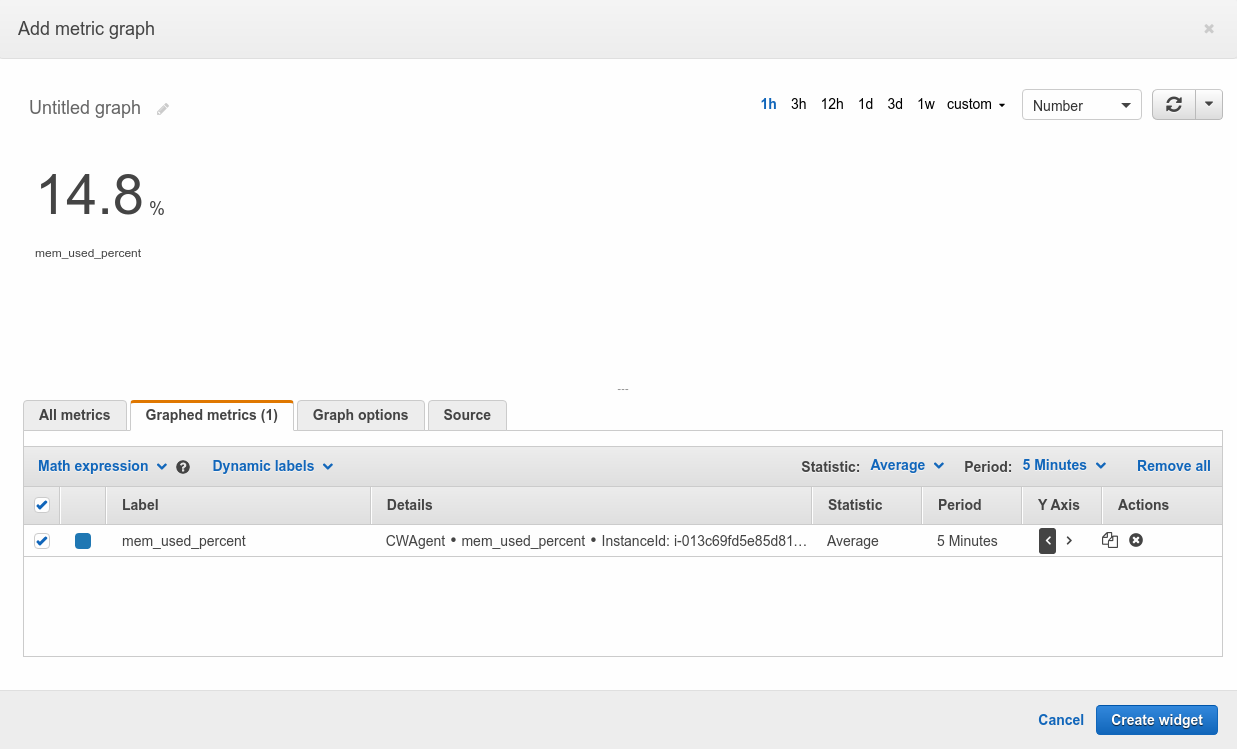
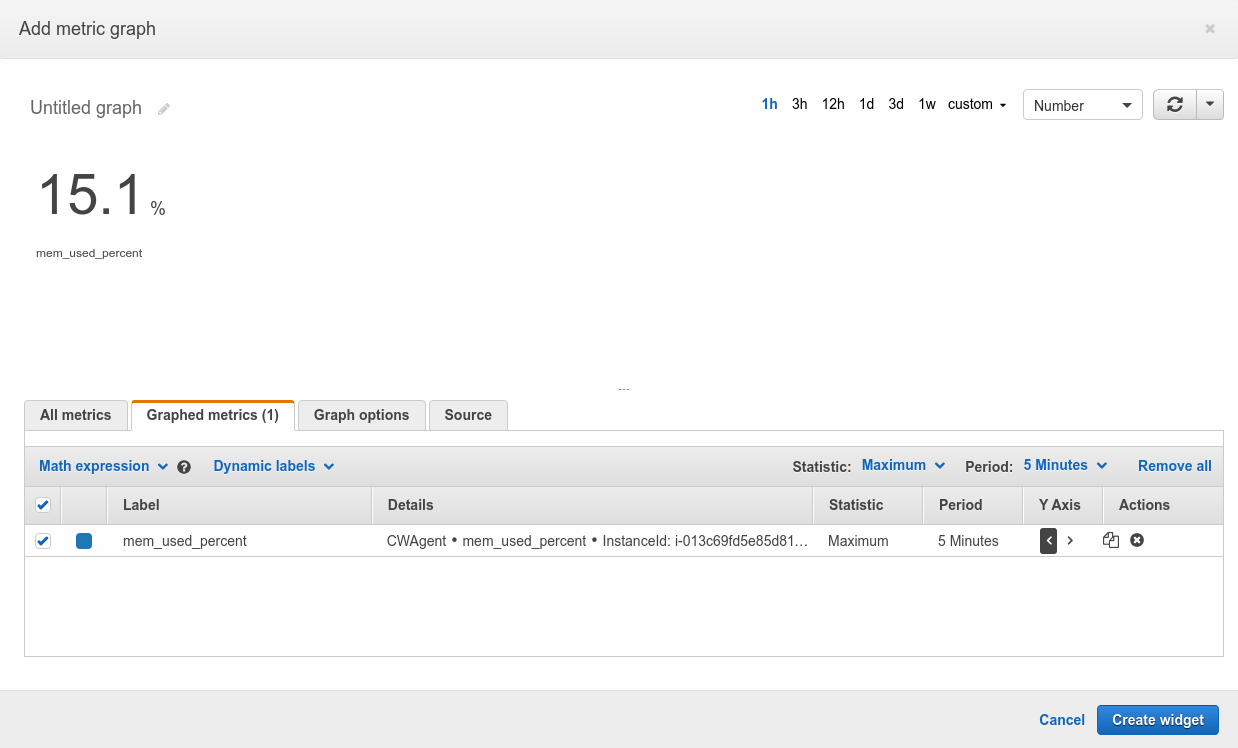
Then click on “Graphed metrics (1)” and replace the “Statistic” from “Average” to “Maximum”
and then we will click on “Create widget”
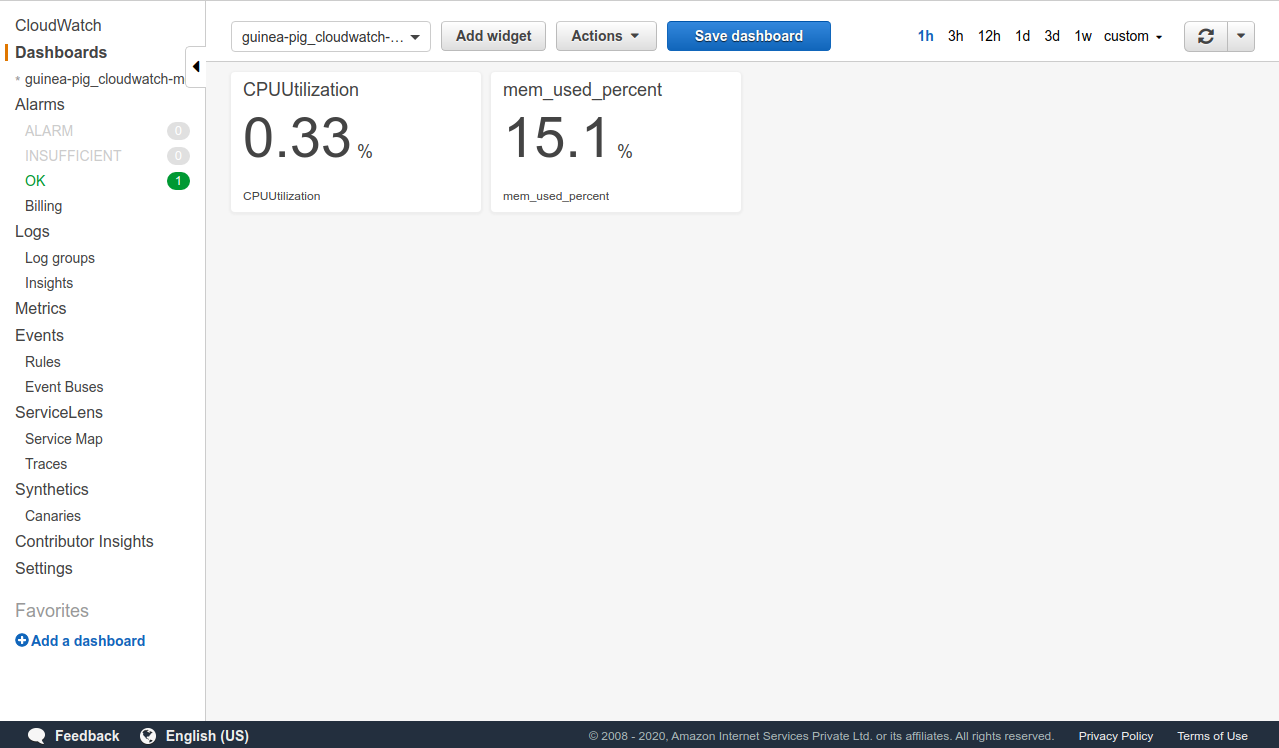
and now on the dashboard now we can see 2 tiles; 1st showing the “CPUUtilization” and the other “mem_used_percent”.
We will follow the same steps that we followed for “mem_used_percent” to get Metrics for “Disk Usage”.
Out of the 3 tiles :-
-> 1st with 22 Metrics
-> 2nd with 7 Metrics
-> 3rd with 2 Metrics
Click on the 1st tile with 22 Metrics and choose “disk_used_percent” with the path “/” as shown in the below screenshot
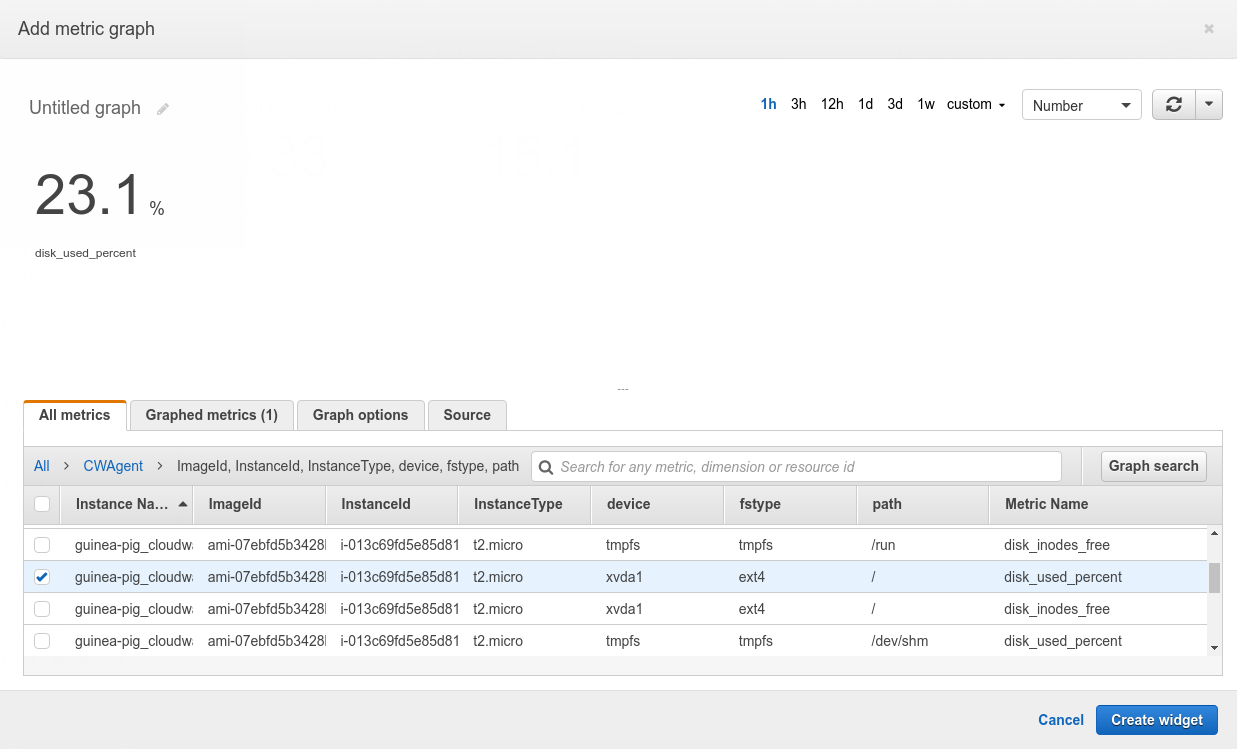
Once that is selected, Then click on “Graphed metrics (1)” and replace the “Statistic” from “Average” to “Maximum”
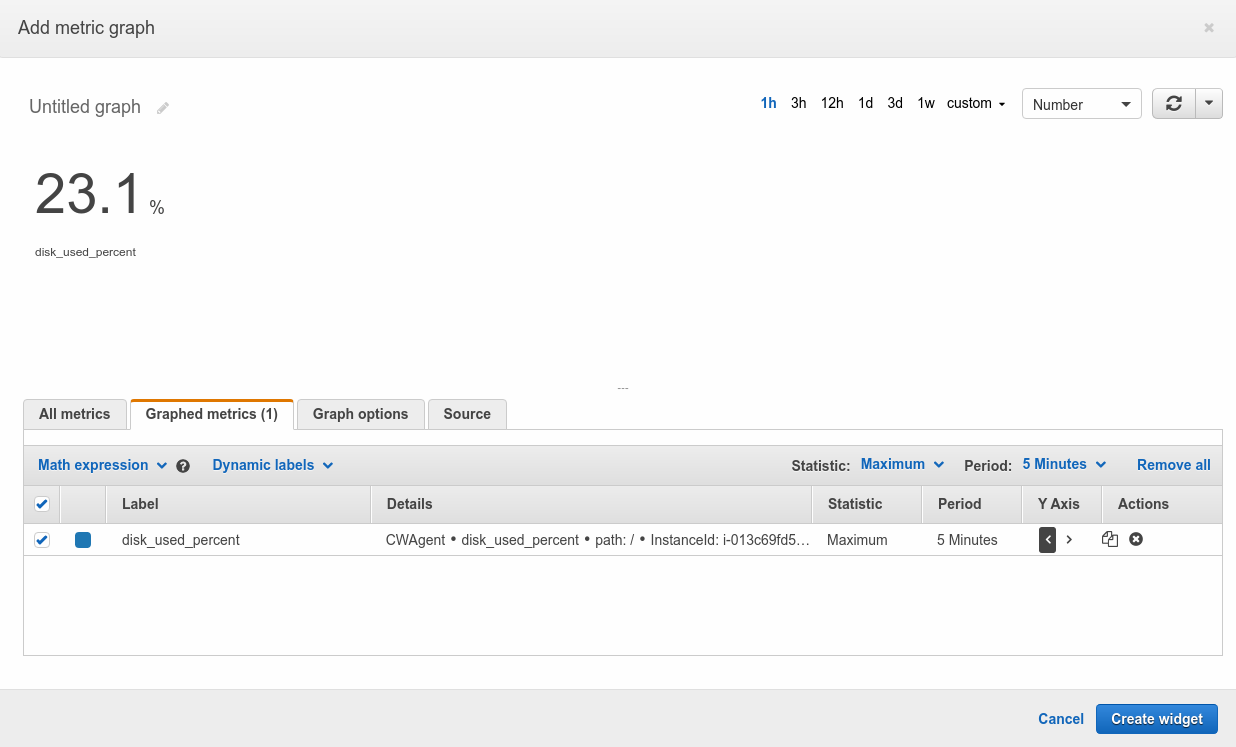
and then we will click on “Create widget”
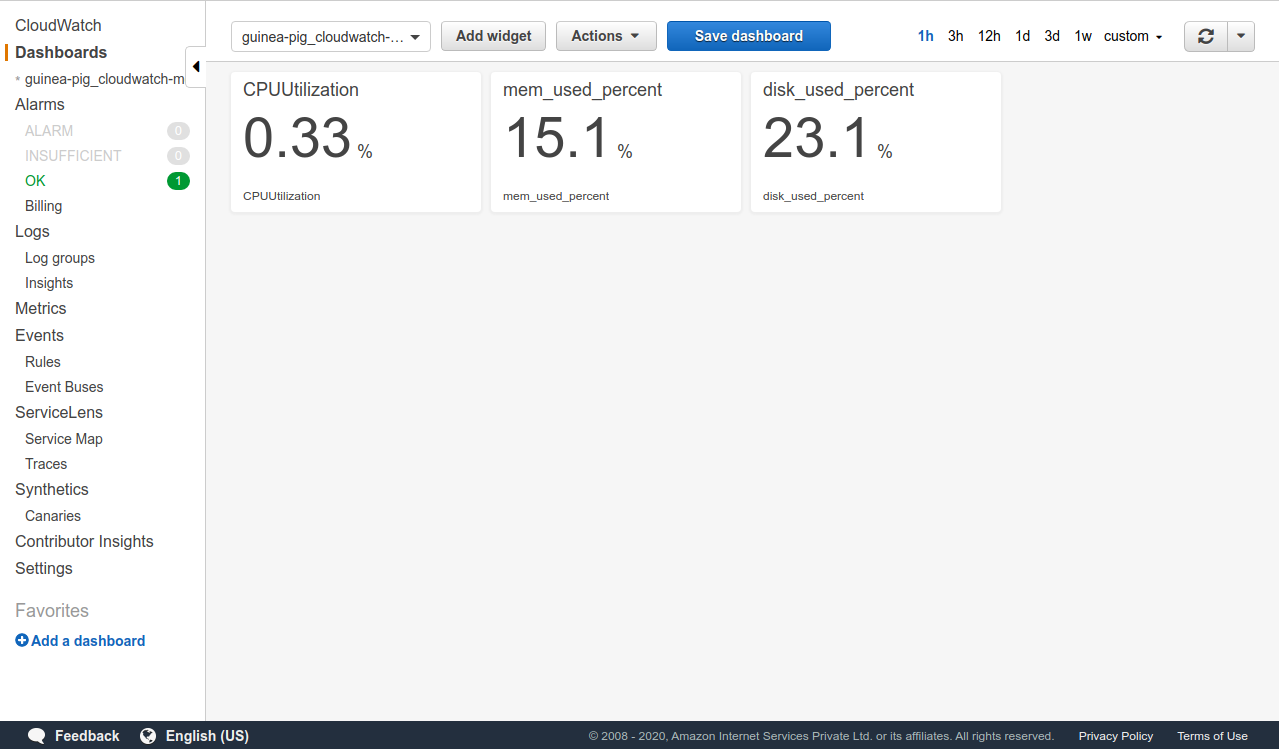
and now on the dashboard now we can see 3 tiles; 1st showing the “CPUUtilization” and the other “mem_used_percent” and the last showing “disk_used_percent”.
These steps are not inclusive and have been taken just to show in a minimal way how you can view metrics, the end-user is expected to change the Metrics that they themselves feel are important for them to monitor. This blog is just a tip of the iceberg; further steps depend on the end-user who can customize the dashboard output according to their unique requirements.
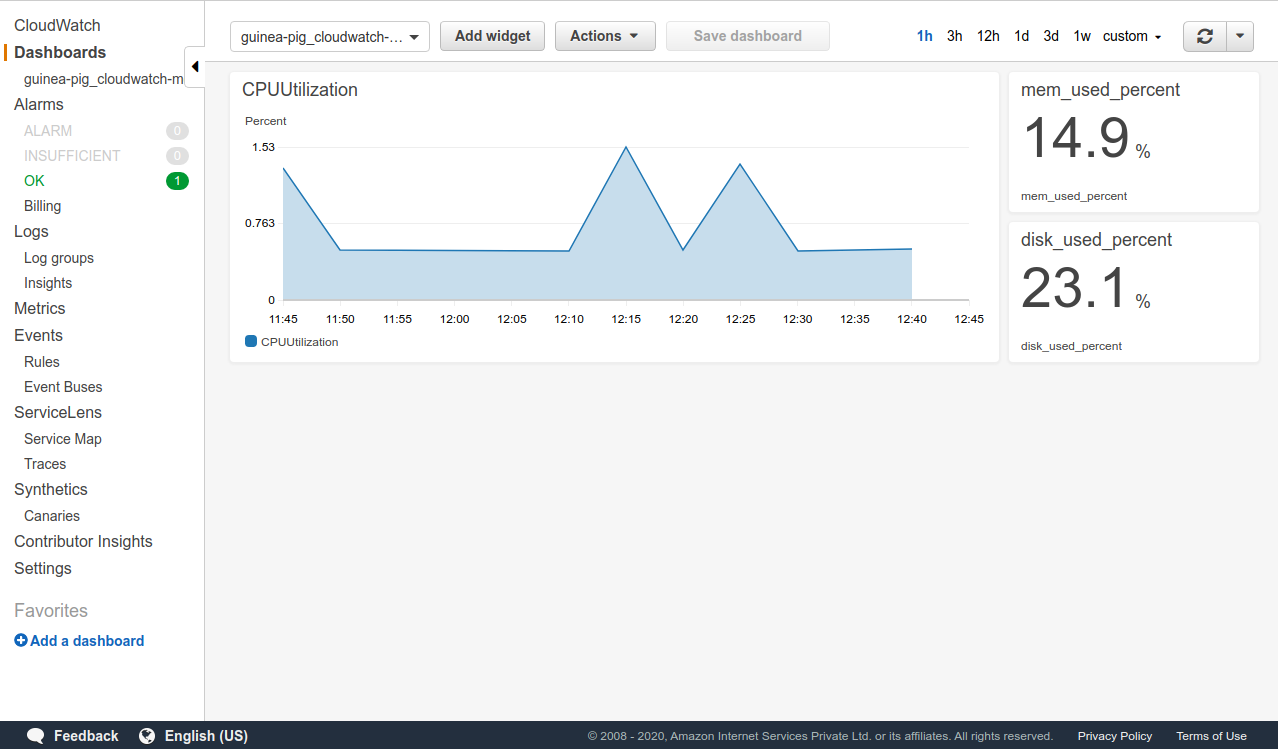
One such example is the above screenshot that you are seeing.
In the end, the cloudwatch dashboard can show you the metrics of your choice.
In the next blog we will move 1 more step forward where we will make the cloudwatch dashboard show a custom log file from inside the Instance to on the Cloudwatch dashboard.

As a Director of Eternal Web Private Ltd an AWS consulting partner company, Nirav is responsible for its operations. AWS, cloud-computing and digital transformation are some of his favorite topics to talk about. His key focus is to help enterprises adopt technology, to solve their business problem with the right cloud solutions.
Have queries about your project idea or concept? Please drop in your project details to discuss with our AWS Global Cloud Infrastructure service specialists and consultants.